FIBONACCI – The Powerful Tool for Trading
Abstract:Fibonacci Lines are a popular and very powerful technical analysis tool that you can use with downward and upward trends, as well as in conjunction with all assets and timeframes.
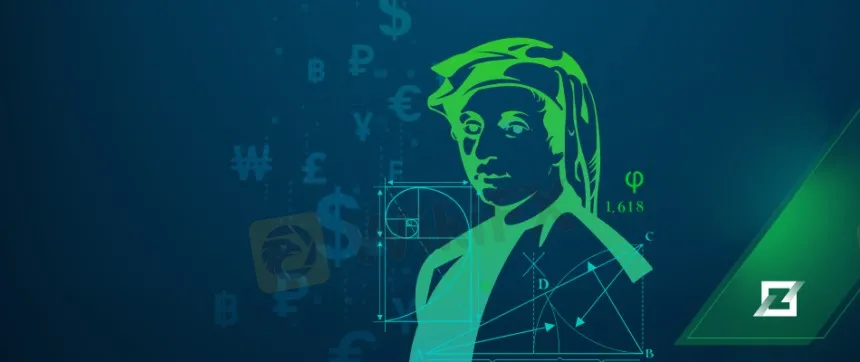
Fibonacci Lines are a popular and very powerful technical analysis tool that you can use with downward and upward trends, as well as in conjunction with all assets and timeframes. Fibonacci retracement is a popular trading indicator used by many traders to identify potential areas of support and resistance in the price of an asset. It‘s represented on a price chart as a group of horizontal lines that correspond to the Fibonacci ratios of 23.6%, 38.2%, 50%, 61.8% and 100%. Having heard about Fibonacci retracement, do you know how does the role of these ubiquitous levels, rooted in straightforward mathematics, play in the market’s movements?
The Fibonacci sequence is a significant set of numbers and ratios that occur in various aspects of life. When employed in trading, traders can seek out countertrend pullbacks in corresponding ratios. Nevertheless, this mathematical tool offers a broad range of applications that can reveal potent trading prospects across the financial markets. By leveraging the insights derived from the Fibonacci sequence, traders can gain a deeper comprehension of market dynamics.
Fibonaccis golden ratio in trading
It‘s named after the Italian mathematician, Fibonacci, and his famous mathematical sequence. Born in 1170 AD, Leonardo Fibonacci was a mathematician who developed both the Fibonacci sequence and the golden ratio. When used correctly, it can effectively help traders to pick the right moment to enter a deal. Let’s take a closer look at their use. The Fibonacci sequence is a sequence of numbers where the subsequent number is the sum of the previous two numbers. As an illustration, the sequence starts with 1, 1, and continues with 2, 3, 5, 8, 13, 21, 34, and so forth.
The primary emphasis lies on the relationship between the numbers in the Fibonacci sequence, which is regarded as the fundamental aspect of Fibonacci‘s work. As we progress down the sequence, dividing any number in the series by the preceding number results in 1.618, known as the ’golden ratio.
Traders commonly utilize Fibonacci retracements in technical analysis to anticipate potential levels of price support and resistance in the markets. Suppose a market has experienced an upward trend but begins to retrace, as all markets do, rather than moving in a linear fashion. Traders will utilize Fibonacci ratios to estimate the level at which the retracement might halt and the market could resume its prior upward trajectory.
The golden ratio of 1.618 – that magic number – gets translated into three percentages: 23.6% (0.236), 38.2% (0.382) and 61.8% (0.618) in price charts.

Illustration of 0.618 in price charts
An example of the Fibonacci pattern
There are five major Fibonacci retracement levels as causes Traders to pay attention 0.236, 0.382, 0.5, 0.618 and 0.6786 in a 0-1 range. You can use the Fibonacci retracement tool in MetaTraer 4/5 platform to draw on any price chart.
The example shows the price of gold when it started from September in 2011 twice in a row it fell then back to the 0.618 level before dropping again. The market rebounds and moves out to fresh highs for the recovery.

XAU/USD in Y2021
Fibonacci Extensions vs Fibonacci Retracements
While Fibonacci retracements examine price action following a breakdown from the pivot cycle highs, Fibonacci extensions establish target levels following a breakout from pivot cycle highs. Depending on the charting software, these Fibonacci extension bands are produced either in the same manner as retracements (starting point at cycle highs, ending point at cycle lows) or in the reverse manner (starting point at cycle lows, ending point at cycle highs). Therefore Fibonacci retracements and extensions serve different purposes in technical analysis.

Fibonacci Extensions vs Fibonacci retracement
• Fibonacci Expansion/Extension
Fibonacci extensions are extremely helpful in determining price target objectives following a breakout. While most technical analysis is backward looking (i.e. analyzing historical prices to determine areas of strength and weakness). The Fibonacci extension or expansion tool is commonly used by traders, as common as moving averages, in establishing potential price targets. Fibonacci levels establish areas of potential resistance/support; thus, extensions have no real value in a ranging market as there are only one potential support and resistance, the market has no prospect of making any higher highs or lower lows.
Fibonacci Extension can be set by finding two points, a swing high and a swing low. If it‘s a downtrend market, you go from high to low and vice versa for an uptrend market. Now, we select the third point, the end of the retracement that’s against the market. The extensions will then calculate the potential price levels the market will move to. These levels are based on Fibonacci ratios and the common levels (as percentages) are 61.8%, 100%, 161.8%, 200% and so on.
So, one may set up a take profit at the 61.8% or the 100% extension.
• Fibonacci Retracement
The Fibonacci extension level, as discussed, shows the potential profit targets we can take. However, to construct it, we must first know the initial retracement. For that we have the extensions counterpart, the Fibonacci Retracement.
The Fibonacci Retracement tool is much like the extension tool but in reverse, it instead will provide you with possible levels where the price will retrace to, giving you the ideal point for setting up the extension tool and potential position entry.
Tips for Drawing The Fibonacci Retracements
The first thing you need to do is to examine the most recent price action and identify a significant swing high and swing low.
When you draw Fibonacci retracement lines, you will measure the peak to trough of the move that you are targeting. The difference between the high and the low is then multiplied by 61.8% and 38.2%. Drawing and constructing the Fibonacci retracement is quite like the extension tool, just without the last step. Two points for setup, a swing and a swing low is all that is needed. Uptrend, swing low to high, downtrend swing high to low, you see the pattern.
Once plotted, the Fib retracement is drawn it shows four common retracements (again in percentages): 23.6%, 38.2%, 50% and 61.8%.
All four levels are common retracements however they are weighted differently. Overall, the 23.6% retracement is considered relatively shallow, they might raise a flag or two but shouldnt be taken too seriously. When the price reaches the 38.2 – 50% range the retracement can be considered moderate, you will see some action and could potentially look for an opening. Even deeper, the 61.8% retracement is also known as the golden retracement.
Once the price hits these retracements, you can start looking for potential entry points. However, it is not wise to immediately take an entry simply because the level has been struck. Trends can always reverse, and prices can always fake-out. After your own method of confirmation, that price is back on the trend, you should confidently open a position.


Read more

Forex Liquidity Provider in 2026: Why the Tightest Spread is Not Always the Best Execution Decision
Choosing a forex liquidity provider is not a search for the lowest displayed spread or the longest provider list. It is a broker decision about pricing integrity, depth, routing, credit, reporting, incident response, and client communication. This 2026 guide explains how a forex LP, FX liquidity provider, or liquidity provider forex arrangement fits into a broker’s execution chain; what to test before onboarding; why a “best forex liquidity provider” claim cannot replace due diligence; and how to compare cost beyond commission. Use the execution-quality scorecard, provider questions, routing scenarios, and 90-day onboarding plan to assess whether a liquidity relationship can support your actual client mix, instruments, risk model, and jurisdiction. The goal is not to make a universal ranking. It is to build evidence that your broker can explain, supervise, reconcile, and recover its execution service when market conditions are difficult.

Copy Trading Gone Wrong? The Mistakes That Could Wipe Out Your Entire Trading Account
We all love trading geniuses and their strategies that earn them profits season after season. And we also love following them to make our investment journey seamless. Copy trading is one such tactic that beginners employ to enter the forex market. What do most of them usually do? They pick an experienced investor from the list and let the platform replicate every trade automatically. The fact that experienced traders continually earn profits, the feeling of copying their trades remains intense. However, the uncertain forex landscape can bite you hard by simply copying trades and not focusing on technical analysis and the charts during the day. Beginners can have a set of preconceived notions that can potentially open the gate for losses. In this article, we have highlighted such mistakes traders should avoid.

"Let Trust Be Seen" WikiFX Industry Initiative Recap, Driving the forex industry toward a more trust
As the global forex market continues to move toward regulatory convergence and greater transparency, “trust,” a concept long and frequently emphasized, is gradually evolving from a subjective perception into a quantifiable and verifiable industry standard. WikiFX announces that its industry initiative, “Let Trust Be Seen,” has achieved phased results, attracting broad attention and participation worldwide.

【WikiEXPO Global Expert Interview】Penetrating Asset Narratives to Understand Trading Risks
On July 23–24, renowned economist Fu Peng will attend WikiEXPO Hong Kong in Hong Kong, joining global industry leaders, regulatory representatives, and fintech experts to discuss the evolving challenges of trading safety amid macroeconomic transformation. Against the backdrop of accelerating restructuring in global financial markets, the trading environment is facing unprecedented uncertainty. To explore this critical theme, WikiEXPO conducted an exclusive interview with Mr. Fu Peng. This interview series will be released in multiple episodes, each focusing on a key question and presenting his in-depth insights into the global trading risk landscape. Following the first episode, which examined macro structural shifts, this third episode turns to one of the most pressing topics for investors today:About asset allocation in an uncertain world, how should investors interpret the concept of “hard currency”? And which asset classes offer greater transparency and more controllable risks?
WikiFX Broker
Latest News
Exness Review 2026 for India: RBI Alert, Regulation, Login and Forex Risk
 WikiFX
18.3 Million Malaysians Participated in National Anti-Scam Campaign
WikiFXXM Review 2026 for India: RBI Alert, Regulation, Login and Forex Risk
WikiFXFXGM Review: A KNF Warning and Withdrawal Complaints to Check Before You Deposit
WikiFXAustralia dollar on longest weekly winning streak since 2020
WikiFXReview 2026: FBS Complaints, Regulation, and Withdrawal Risk Signals
WikiFXRoboForex Review: Regulation Alarms Hit a Broker Facing Profit-Wipe Complaints
WikiFXThree Losses in a Row? Rebuild Clear Decisions, Not Revenge
WikiFXTraders Home Review: Is Your Deposit Safe?
WikiFXA Tiny USDT Transfer Could Put Your Crypto Wallet Under Scrutiny
WikiFXRate Calc

