TECHNICAL ANALYSIS
摘要:Get key insights on current market trends in forex, commodities, indices and other instruments to keep you inf
Get key insights on current market trends in forex, commodities, indices and other instruments to keep you informed of your trading strategy
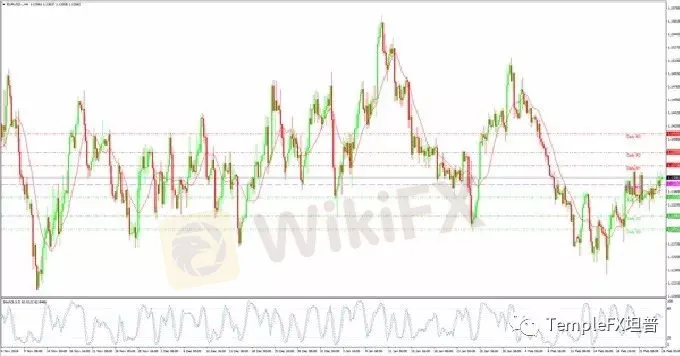
EUR/USD Intraday Bullish
Pivot point:1.1349
Resistance level 1: 1.1373 Resistance level 2: 1.1390 Resistance level 3: 1.1415
Support level 1: 1.1332 Support level 2: 1.1308 Support level 3: 1.1291
Comment: EUR/USD is showing bullish signs as the pair managed to break resistance level of yesterday. A break above the resistance level of 1.1373 could make the bullish outlook clear and lead the pair further to 1.1390 area. However, breaking below the support level of 1.1332 may bring back the bearish trend.
USD/JPY Intraday Bullish
Pivot point:110.95
Resistance level 1: 111.33 Resistance level 2: 111.60 Resistance level 3: 111.98
Support level 1: 110.67 Support level 2: 110.29 Support level 3: 110.02
Comment: The USD/JPY pair is still holding its bullish stance. The pair broke resistance levels in the last trading session. There are possibilities of going above today‘s resistance level of 111.33 and extend further to 111.60 level. On the other hand, a fall below today’s support level of 110.67 may push the pair down to 110.29 area.

GBP/USD Intraday Bullish
Pivot point:1.3084
Resistance level 1: 1.3123 Resistance level 2: 1.3150 Resistance level 3: 1.3189
Support level 1: 1.3057 Support level 2: 1.3018 Support level 3: 1.2990
Comment: The GBP/USD pair indicates bullish signs as the pair has been trading higher in the last few sessions. It is looking to break above the resistance level of 1.3123 and extend further to 1.3150 area. Alternatively, breaking below 1.3057 could put the pair under pressure and drive the prices down to 1.3018 level.

AUD/USD Intraday Neutral
Pivot point:0.7159
Resistance level 1: 0.7189 Resistance level 2: 0.7212 Resistance level 3: 0.7242
Support level 1: 0.7135 Support level 2: 0.7106 Support level 3: 0.7082
Comment: The AUD/USD indicates an unclear trend as the pair stayed within the range. A break above the resistance level of 0.7189 may put the pair into a bullish territory and lead the prices further to 0.7212 area while breaking below the support level of 0.7135 may follow an extension of 0.7106 level.

NZD/USD Intraday Bullish
Pivot point:0.6878
Resistance level 1: 0.6904 Resistance level 2: 0.6927 Resistance level 3: 0.6953
Support level 1: 0.6856 Support level 2: 0.6829 Support level 3: 0.6807
Comment: The NZD/USD is exhibiting an upward direction. The pair managed to break resistance level of yesterday. Breaking above today‘s resistance level of 0.6904 may confirm the bullish trend. However, breaking below today’s support level of 0.6856 may put the pair into neutral territory and drive the prices down to 0.6829 area.

USD/CHF Intraday Neutral
Pivot point:0.9999
Resistance level 1: 1.0016 Resistance level 2: 1.0027 Resistance level 3: 1.0044
Support level 1: 0.9987 Support level 2: 0.9970 Support level 3: 0.9959
Comment: The USD/CHF pair is still exhibiting a neutral trend having no clear direction. The pair broke below its first support level in the last trading session but bounced back afterwards and traded within range. Breaking below the support level of 0.9987 could bring back the bearish trend and push the prices down to 0.9959 area. Alternatively, a break above its first resistance level of 1.0016 may reverse the trend and extend further to 1.0027 area.

USD/CAD Intraday Neutral
Pivot point:1.3164
Resistance level 1: 1.3217 Resistance level 2: 1.3249 Resistance level 3: 1.3302
Support level 1: 1.3132 Support level 2: 1.3079 Support level 3: 1.3048
Comment: The USD/CAD is now showing an unclear trend as the pair traded in a lower range at the beginning of yesterday but appreciated until the end afterwards. A break below the first support level of 1.3132 could push the pair lower to 1.3048 levels. Alternatively, a breach above 1.3249 could start a bullish trend.

Dow Jones Futures (CME) (Z18) Intraday Bullish
Pivot point:26123
Resistance level 1: 26205 Resistance level 2: 26324 Resistance level 3: 26405
Support level 1: 26005 Support level 2: 25923 Support level 3: 25804
Comment: Dow Jones is now showing a clear upward trend as the index advanced again in the last trading session. After the market opened, it advanced 230 points at most and ended with a gain of 60 points. A break above 26205 could make the bullish trend stronger and extend the index to 26405 or above. On the other hand, a break below of 25923 could be an adjustment of the index which indicates an unclear trend.

Gold Spot Intraday Neutral
Pivot point:1328
Resistance level 1: 1331 Resistance level 2: 1335 Resistance level 3: 1338
Support level 1: 1324 Support level 2: 1320 Support level 3: 1316
Comment: Gold is now showing an unclear trend after failed to remain above 1340. After breaking above 1340, it tumbled and traded within a lower range in the last few trading sessions. 1320 could be a strong support level for gold, if breaking below this level might indicate a bearish trend. Alternately, if gold breaks 1340 again and remains above it then the bullish trend is possible to happen again.

Crude Oil Intraday Neutral
Pivot point:56.13
Resistance level 1: 57.05 Resistance level 2: 58.57 Resistance level 3: 59.49
Support level 1: 54.61 Support level 2: 53.69 Support level 3: 52.17
Comment: Crude oil is still showing an unclear trend as it failed to remain above 57.25. After the market opened, the price of oil advanced in the beginning due to good news brought by trades between China and the US. But the price plunged after president Donald Trump commented about high oil prices and criticize OPEC. Breaking above the resistance level of 58.57 could bring back the bullish trend. Alternatively, a break below its first support level of 54.61 may reverse the upward trend.

Disclaimer
These analyses are for information purposes only. They do not post a buy or sell recommendation for any of the financial instruments herein analyzed. The information is obtained from generally accessible data sources. TS capital assumes no responsibility for errors, inaccuracies or omissions in these materials, nor shall it be liable for damages arising out of any person's reliance upon the information on this page. TS capital shall not be liable for any special, indirect, incidental, or consequential damages, including without limitation, losses or unrealized gains that may result. Any information is subject to change without prior notice.


天眼交易商
汇率计算

