DBG Markets: Market Report for June 26, 2026
Abstract:Post-PCE Bring Headwind to Risk-Asset US Indices, Dollar, Gold Bitcoin OutlookGlobal financial markets faced a volatile finish to the week as investors fully processed the freshly released US Persona

Post-PCE Bring Headwind to Risk-Asset
US Indices, Dollar, Gold & Bitcoin Outlook
Global financial markets faced a volatile finish to the week as investors fully processed the freshly released US Personal Consumption Expenditures (PCE) price index. The highly anticipated inflation report came in hot, effectively validating the Federal Reserves recent hawkish stance and cementing market expectations for an upcoming interest rate hike cycle.
Hot May PCE Validates Fed Tightening Paths
The US May headline PCE price index print rose by 4.1% year-over-year, landing exactly in line with market forecasts. Meanwhile, the Core PCE price index, which strips out volatile food and energy components, ticked up to 3.4% as expected. The convergence of these two inflation metrics indicates that previous energy-driven inflation spikes have systematically passed through to broader underlying price pressures.
US Indices: Corrective Pressures Solidify
Major equity benchmarks are exhibiting cautiously mixed technical setups. Both the S&P 500 and the Nasdaq 100 (which are more tech-heavy weighted) are entering a defined corrective phase, resulting in a structural consolidation move across their broader-timeframe trends.
Nasdaq 100 (UT100) Outlook
Tech shares remain at the epicenter of the current liquidation wave as rising yields clip high-multiple growth stock valuations.
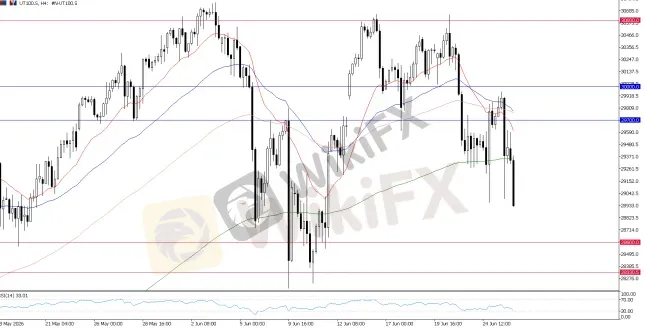
UT100, H4 Chart
After forming a three-time resistance near 30,600 that we covered earlier, followed by a break below 30,000, all technical points suggest a turn in recent bullish momentum. While we have yet to see a full bear market, we expect a period of corrective moves next, with the index expected to end on a strong bear candle.
S&P 500 Outlook
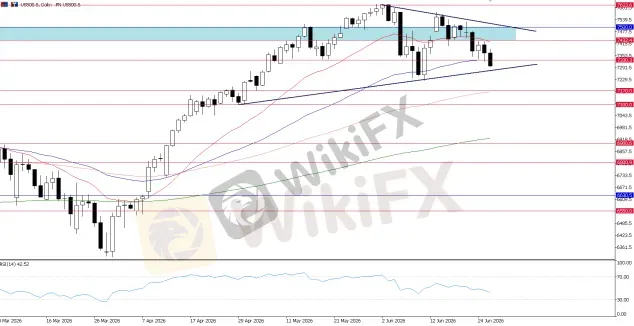
S&P 500, Daily Chart
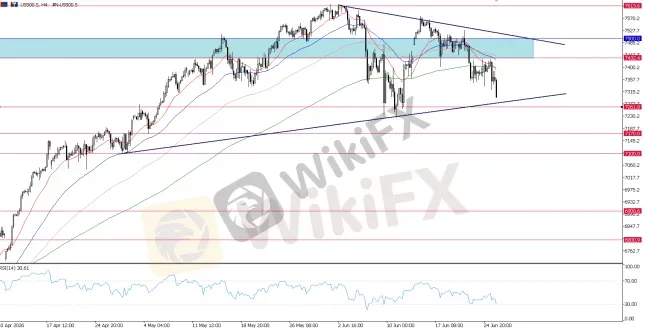
S&P 500, H4 Chart
Similarly, for the US500 (S&P 500), trading below 7,500 signals a deeper correction. Over the daily chart, we are also seeing a potential converging triangle forming, which means the trend has now turned into a consolidation phase.
For the intraday or near-term outlook, caution is still warranted as the index could still retest the 7,260 level.
US Dollar Index : Pullback Tests Pivotal Support
Despite giving up some intraday gains to profit-taking post-data, the greenback continues to trade at highly elevated levels.
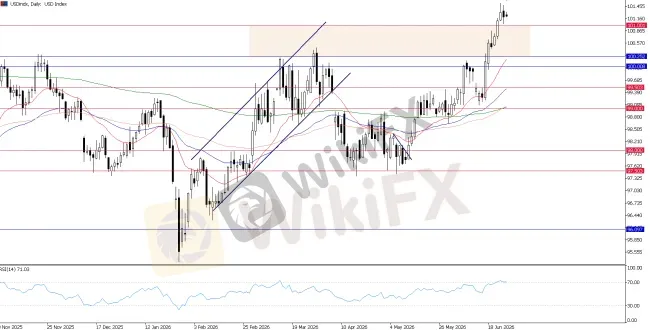
USD Index, H4 Chart
The US Dollar Index experienced a temporary pullback but managed to defend its near-term support above the 101.00 handle. Today's primary technical focus centers entirely on whether buyers can hold this 101.00 floor, while the macro key support zone truly lies at the 100.00 – 100.25 area.
Gold: Counter-Trend Rebound Faces Heavy Supply
Spot gold managed a minor technical bounce, capitalizing directly on the post-PCE cooling of the US Dollar.
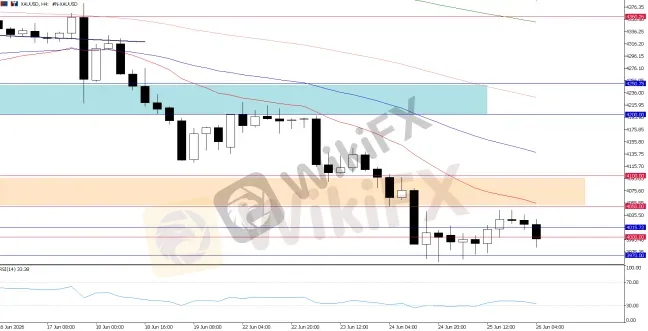
XAUUSD, H4 Chart
Despite the short-term relief rally, the broader commodity structure remains heavily capped. Gold continues to face intense overhead pressure below the critical $4,050 area. The underlying bias remains bearishly skewed, with prices expected to continue testing the pivotal $4,000 psychological milestone.
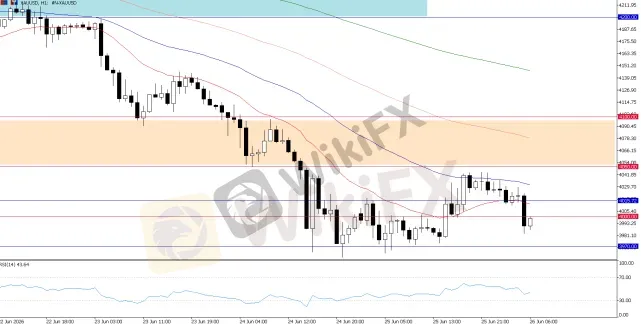
XAUUSD, H2 Chart
Meanwhile, on the near-term intraday setup, we see a potential short-term bullish reversal/breakout. However, we need to see a strong hold above 4,000 to expect an intraday rebound. If 4,000 holds, we can expect another retest toward the 4,050 level again.
Bitcoin (BTC/USD): Defending Macro Baselines
The digital asset complex continues to face severe macroeconomic headwinds as tight global liquidity dampens speculative appetite.
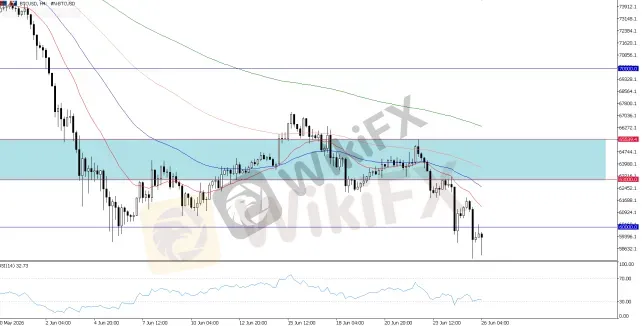
BTCUSD, Daily Chart
Driven by hardening central bank tightening bets and near-term technical breakdowns, the outlook remains fragile.
· A confirmed daily close below the $60,000 support floor will open up a wave of secondary selling pressure.
· Conversely, if Bitcoin regains its footing above 60,000, it means buyers are still actively defending this floor; we can then watch for short-term support and see if it can successfully turn into a broader structural base.
Bottom Line & Asset Summary
Capital allocation continues to pivot into defensives, leaving tech indices and crypto in deep corrective structures.
· US Tech 100 (UT100): Bearish/Corrective; trading below 30,000 after validating triple-top resistance at 30,600, with further risk toward 28,300.
· S&P 500 (US500): Neutral to Consolidation; trading below 7,500 into a daily converging triangle, with a near-term downside risk of testing 7,260.
· US Dollar Index: Structurally Bullish; pulling back to test the immediate 101.00 floor, but the broad uptrend remains intact as long as the 100.00 – 100.25 macro zone holds.
· Gold: Bearish/Consolidation; experiencing a minor bounce but heavily capped below $4,050; needs to cleanly hold $4,000 to trigger an intraday retest of higher liquidity pockets.
· Bitcoin (BTC/USD): Weak/Testing Support; balancing precariously on the final defense line at $60,000, where a clean daily close below risks rapid selling acceleration.


WikiFX Broker
Latest News
RoboMarkets Review: Regulation Questions Around a Broker Facing Fresh Trading Complaints
 WikiFX
Review 2026: Deriv Regulation, Complaints, and Withdrawal Risk Signals
WikiFXDSI Exposes Alleged Forex Empire Behind Billion Baht Scam, Money Laundering and Political Connection
WikiFXIUX Review:Before Investing a Single Penny, Read These Jaw-Dropping Deposit & Withdrawal Experiences
WikiFXStop Trading in the Middle of Ranging Forex Markets
WikiFXFXTF Review 2026: Regulation, Withdrawals, and Scam Allegations
WikiFXIG Review 2026: Is This Forex Broker Safe?
WikiFXsquaredfinancial Review 2026: Is This Forex Broker Safe?
WikiFXFXTF Review 2026: Japan FSA Regulation, Platform Access, and Exposure Cases
WikiFXReview 2026: FBS Regulation, Complaints, and Withdrawal Risk Signals
WikiFXRate Calc

