FPG EURUSD Market Report April 9, 2026
Abstract:On the H1 timeframe chart, EURUSD initially moved in a relatively stable sideways range between 1.1504 and 1.1575, reflecting a consolidation phase at the beginning of the month. A couple days ago, a
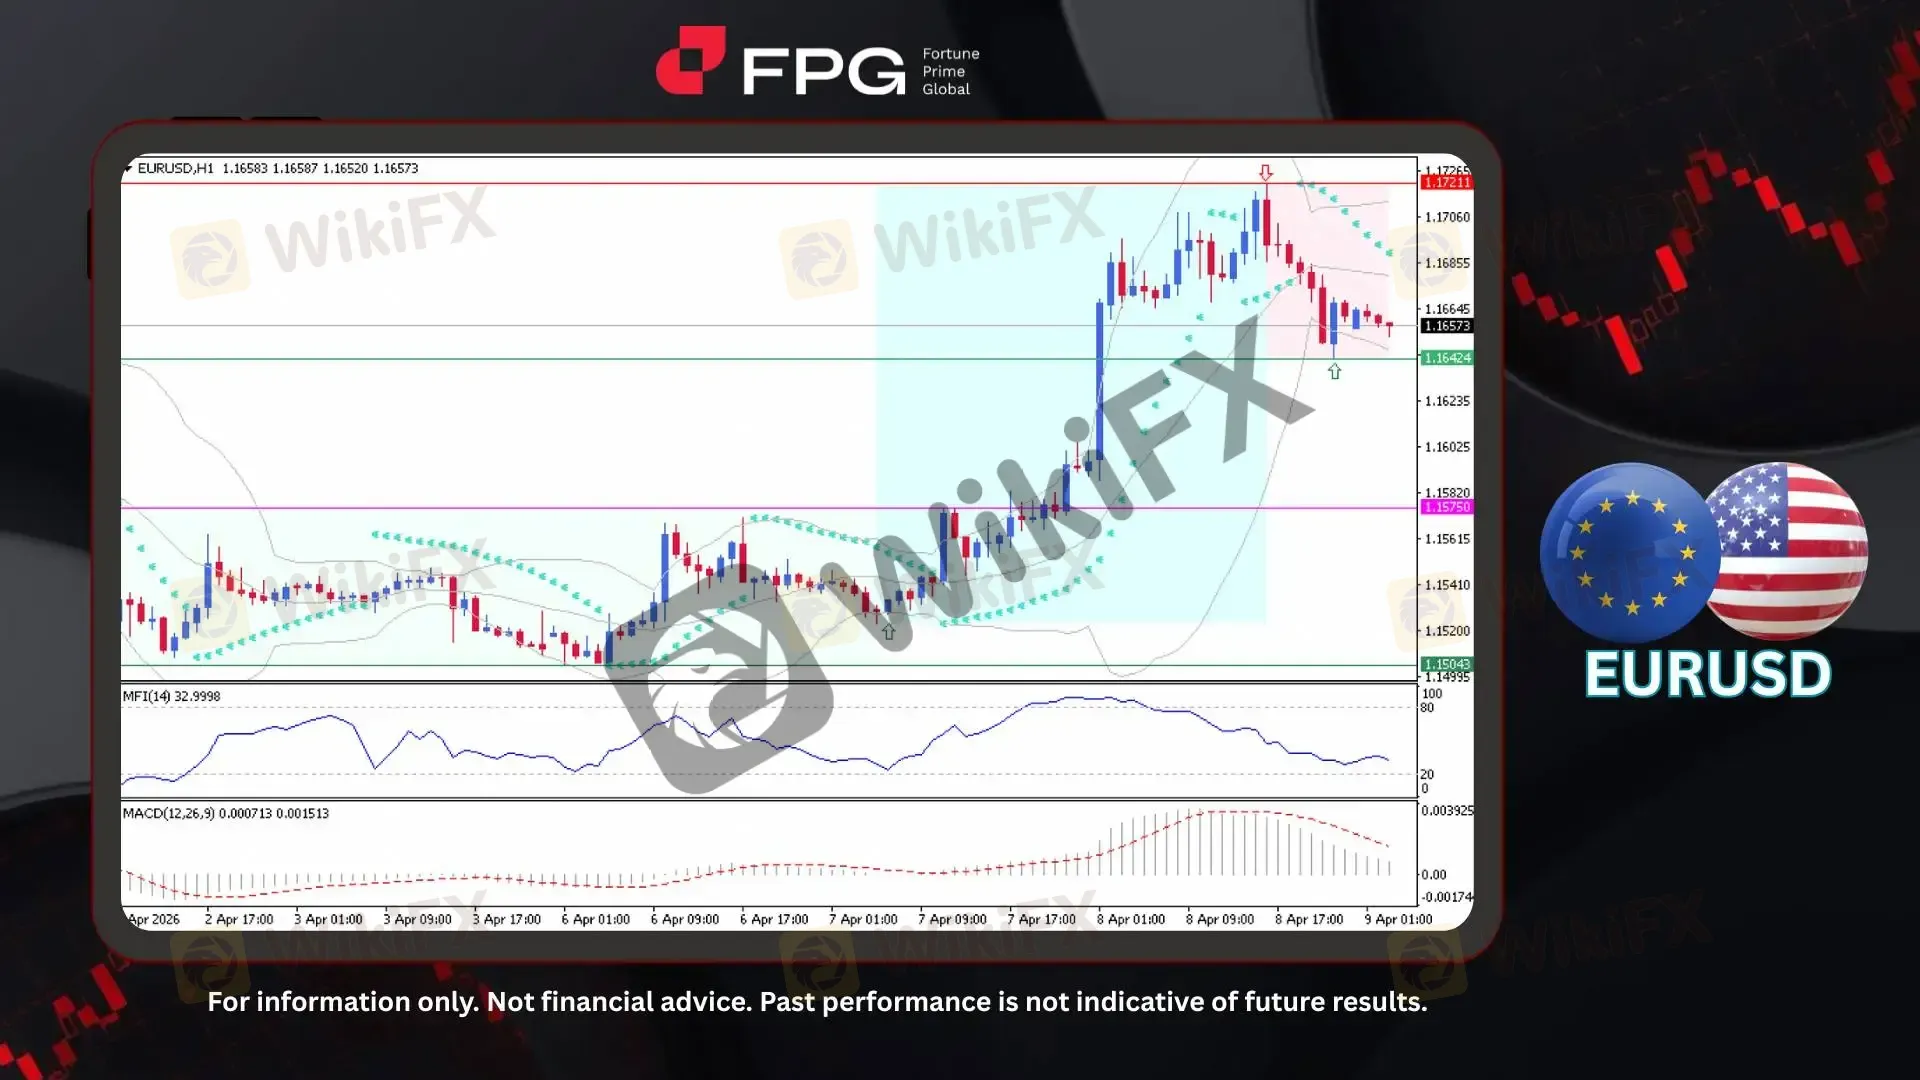
On the H1 timeframe chart, EURUSD initially moved in a relatively stable sideways range between 1.1504 and 1.1575, reflecting a consolidation phase at the beginning of the month. A couple days ago, a strong bullish breakout occurred, pushing the price above resistance and driving it up to a peak at 1.1721. However, from that peak, a clear rejection was formed, triggering a bearish correction that brought the price down toward 1.1642. Currently, EURUSD is trading around 1.1657, showing moderate volatility as the market stabilizes after the recent pullback.
From a technical perspective, Bollinger Bands expanded significantly during the bullish breakout, indicating increased volatility, but are now beginning to narrow slightly as price consolidates. The price is currently moving near the middle band, suggesting a neutral short-term bias after the correction. The MFI (14) is around 32.99, indicating that buying pressure has weakened and the market is approaching a lower momentum zone. Meanwhile, the MACD (12,26,9) shows a declining histogram with values around 0.000713 / 0.001513, reflecting fading bullish momentum and a potential continuation of short-term consolidation or mild bearish pressure.
Global sentiment is driven by easing geopolitical tensions, which has weakened the USD and supported a risk-on environment. However, the Federal Reserves stance on persistent inflation continues to provide intermittent support to the dollar, while the Eurozone outlook remains relatively fragile. As a result, EURUSD previously strengthened due to USD weakness, but today's slight pullback reflects a short-term USD rebound and profit-taking rather than a full trend reversal.
Technical Market Overview
1. Current Position: EURUSD is trading around 1.1657, consolidating after a bearish pullback from the recent high at 1.1721.
2. Resistance Zone: The nearest resistance is located at 1.1721, representing the recent peak and a key supply zone.
3. Support Zone: Immediate support stands at 1.1642, with stronger support below at 1.1575, marking the previous breakout level.
4. Indicator Observation: MFI (14) is at 32.99, signaling weakening buying pressure, while MACD (12,26,9) shows a declining histogram, indicating fading bullish momentum and increasing consolidation risk.
5. Technical Summary: EURUSD remains in a post-breakout consolidation phase after a strong bullish rally, with momentum indicators showing signs of weakening strength, suggesting a potential continuation of sideways movement or a mild corrective phase unless strong buying pressure re-emerges.
Market Performance:
Forex Last Price % Change
USD/JPY 158.71 +0.11%
GBP/USD 1.3393 −0.02%
Today's Key Economic Calendar:
US: Fed Daly Speech
US: FOMC Minutes
UK: RICS House Price Balance
JP: Consumer Confidence
DE: Balance of Trade
DE: Exports MoM
DE: Industrial Production MoM
US: Core PCE Price Index MoM
US: Corporate Profits QoQ
US: GDP Growth Rate & GDP Price Index QoQ Final
US: Initial Jobless Claims
US: PCE Price Index MoM & YoY
US: Personal Income & Spending MoM
Risk Disclaimer: This report is for informational purposes only and does not constitute financial advice. Investments involve risks, and past performance does not guarantee future results. Consult your financial advisor for personalized investment strategies.

WikiFX Broker
Latest News
Mr Pips Forex Scam Exposed as Losses Hit RM240 Million
 WikiFX
CySEC Sets 8 May Deadline for CFD Brokers to File Last Year’s Data
WikiFXQ2 Broker Evaluation Campaign V2.0
WikiFXNZD Strength Without a Rate Hike: The Market Is Pricing a Policy the RBNZ Has Not Delivered
WikiFXCLEANO Review 2026: Is this Forex Broker Legit or a Scam?
WikiFXChina’s Renminbi Challenges Dollar Dominance | What It Means for Malaysia
WikiFXNew Traders Keep Losing — And It's Not Because of Their Strategy
WikiFXDubai Warning Issued After Fraudsters Impersonate a Legitimate DIFC Financial Firm
WikiFXItaly Blocks 32 More Unauthorized Financial Websites
WikiFXFXTM Moves to Deepen UAE Presence with Planned Licence Upgrade
WikiFXRate Calc
