LTCUSD analysis for 20.11.2023
Abstract:The LTCUSD pair signifies the value of Litecoin (LTC) in terms of US dollars. Fundamental factors influencing LTC include adoption trends, technological advancements such as the implementation of MimbleWimble for privacy and scalability, and overall market sentiment towards altcoins.

Fundamental Analysis:
The LTCUSD pair signifies the value of Litecoin (LTC) in terms of US dollars. Fundamental factors influencing LTC include adoption trends, technological advancements such as the implementation of MimbleWimble for privacy and scalability, and overall market sentiment towards altcoins. External influences like regulatory news, economic indicators from the US, and Bitcoins market movements can also greatly affect LTCUSD. Given the volatility of the crypto market, these factors can lead to significant price swings.
Price Action:
The LTCUSD chart on the H4 timeframe indicates a volatility contraction pattern, as evidenced by the Bollinger Bands narrowing, followed by a slight downturn in recent sessions. The price action is currently within the lower half of the Bollinger Band range, showing a short-term bearish bias.
Key Technical Indicators:
Bollinger Bands: The price is testing the lower Bollinger Band, hinting at a potential short-term oversold condition or the beginning of a bearish trend.
Parabolic SAR: The dots are above the price, which suggests a downtrend is currently in place.
Volumes: There is a visible increase in volume during the downward price bars, indicating a stronger bearish sentiment.
MACD: The MACD line is below the signal line and approaching negative territory, which supports the bearish momentum seen in the price action.
Support and Resistance:
Support: The nearest support level is at the $58 area where previous price action showed consolidation.
Resistance: The resistance is likely to be at the upper Bollinger Band, around the $74 mark, where the price previously peaked.
Conclusion and Consideration:
The technical analysis of LTCUSD on the H4 chart suggests a bearish outlook in the short term, with indicators like the Bollinger Bands and Parabolic SAR supporting this view. The increase in volume on down bars and the MACD‘s position below the signal line reinforce the strength of the current downtrend. Traders should look for potential reversal signals near the support level or a continuation of the trend if the price fails to rally. It’s important to monitor for any fundamental changes that could affect market sentiment and lead to a shift in price direction.


Read more
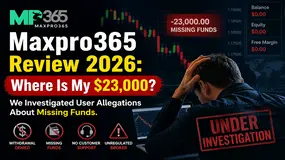
Maxpro365 Review 2026: Where Is My $23,000? We Investigated User Allegations About Missing Funds
MaxPro365, a Costa Rica-based brokerage entity, is indeed accused of allegations concerning missing funds. The allegations have come specifically from Indian users. One striking claim we came across talked about missing funds worth $23,000. All of these allegations indicate a potential investment scam. In this Maxpro365 review, we have investigated several user allegations and provided an overview of the regulatory framework.
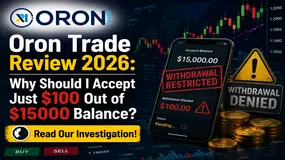
Oron Trade Review 2026: Why Should I Accept Just $100 Out of $15000 Balance? Read Our Investigation!
This is the problem an Indian trader reportedly faced on the Oron Trade platform. The Saint Lucia-based forex broker, despite receiving positive reviews for a low minimum deposit and a 5% monthly withdrawable bonus, continued to be criticized by users for its withdrawal processing. In this Oron Limited review, we have thoroughly investigated user claims and revealed whether this brokerage firm is regulated.
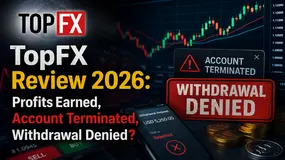
TopFX Review 2026: Profits Earned, Account Terminated, Withdrawal Denied? Check This Investigation
TopFX, a Cyprus-based brokerage entity, continues to face user allegations globally, including those in South Asia. While complaints against the firm are on several issues, the one that is very concerning is the alleged account termination following a withdrawal request by traders upon profit generation on the platform. Traders have even opposed deposit delay and operational glitches concerning leverage. In this TopFX review, we have examined wide-ranging allegations against the broker while also sharing its regulatory framework for an informed decision-making experience.
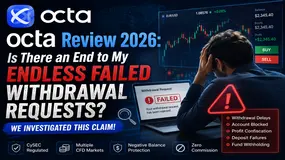
octa Review 2026: Is There an End to My Endless Failed Withdrawal Requests? We Examined This Claim
octa, a Cyprus-based brokerage company, continues to face a common question from traders: when will my withdrawal requests be successfully processed? Maybe not literally, but contextually, it is allegedly the issue many traders have reported on broker review platforms such as WikiFX. Regardless of the trader’s region, be it South Asia, Indonesia, Brazil or any other, most traders have expressed their concerns over the alleged withdrawal delays or denials. In this octa review, we have examined several user allegations concerning withdrawal issues and other problems encountered on the platform.
WikiFX Broker
Latest News
Malaysia’s Pension Fund (KWAP) Hit by eFishery Fraud Scandal with RM163 Million at Risk
 WikiFX
EMAR MARKETS Review 2026: FSCA Regulation, Withdrawal Complaints, and Account Access Risks
WikiFXFacing a 20% Floating Loss: How Beginners Can Prevent a Margin Call
WikiFXInstaForex Review 2026: Is This Forex Broker Safe?
WikiFXSandStoneFX Review 2026: Is This Forex Broker Safe?
WikiFXFake Investment Scam and Human Trafficking Network Busted with 109 Arrested
WikiFXForex Traders With Day Jobs: The PERKESO Deadline You Cannot Ignore
WikiFXMaxpro365 Review 2026: Where Is My $23,000? We Investigated User Allegations About Missing Funds
WikiFXHow Trading Costs Quietly Drain Your Account: Spreads, Swaps, and Pip Values
WikiFXWhy MetaTrader 4 Remains the Top Choice for Testing Automated Trading Robots
WikiFXRate Calc

