What is the best indicator for the breakout strategy?
Abstract:The story of Netflix’s breakout in 2013 is a prime example of why you need to spot trading opportunities in time. For nearly two years, the company’s stock price was stuck in a range between $50 and $130. But then, in October of 2013, Netflix released a game-changing earnings report, and the price had soared to $389 by the end of the year.
The story of Netflix‘s breakout in 2013 is a prime example of why you need to spot trading opportunities in time. For nearly two years, the company’s stock price was stuck in a range between $50 and $130. But then, in October of 2013, Netflix released a game-changing earnings report, and the price had soared to $389 by the end of the year.
This is where using the right tools to spot such opportunities becomes crucial. If you want to learn more about breakout strategies and what indicators to use, read on.
In short: what is a breakout strategy?

A breakout strategy is a popular trading approach that involves identifying and taking advantage of significant price movements in financial markets. The goal is to capture the gains that occur when the price breaks through a key level of support or resistance. These are price points where the asset has previously bounced off. For example, if an asset has been trading between $50 and $60 for several months, a breakout would occur if the price rises above $60 or falls below $50.
When the price breaks through a key level, it suggests that there has been a significant shift in market sentiment. In a short while, you may be seeing a rush of buying or selling activity among traders.
Traders who use breakout strategies are searching for big price movements in financial markets. These events can be triggered by external factors like news or economic data or internal factors like a companys management or financial performance.
Importance of using indicators in breakout strategy
In a breakout strategy, traders will often use indicators to identify potential breakouts and confirm the validity of a breakout. Without them, you would have to rely solely on your interpretation of price action. And this can be subjective and is prone to errors.
If you want to have a quantitative and objective measure of market conditions, you cant do without indicators. Sure, indicators alone may not provide a complete picture of the market. But when used properly and in conjunction with other forms of analysis, they are a source of valuable insights.
Four best breakout indicators for traders
Here are the four best indicators that every breakout trader needs to know:
Volume indicator
Volume is a good indicator to confirm a breakout, as it provides insights into the strength or weakness of a price movement. The indicator will tell you whether the price movement is sustained and or will likely return to its previous trading range.
When an asset price reaches established levels of support or resistance, the volume should increase because there will be more active traders in the market. If the volume doesn‘t pick up at these levels, it signals that the breakout is not strong. Without volume, it’s likely to be a fakeout.
MACD
One of the possible use cases is if you expect a breakdown of resistance, look at the MACD—and if the indicator rises above 0, this may be a confirmation that the asset is going to experience further growth and vice versa.
You can also use the divergence between the price and the indicator. If there is a bullish divergence on the chart and the price is near the resistance, it may confirm the upward breakout. And if its bearish and the price is near the support, the reading confirms the downward breakout.
Bollinger Bands
Using Bollinger Bands for breakouts is based on the idea that the vast majority of closing prices should fall within the bands. If you‘re in need of a quick recap, these are two standard deviations away from a simple moving average, and they create a channel of volatility around the price. An asset’s price breaking outside the Bollinger Bands is rare, so this event would point out potential buy or sell signals.
When the price nears a support or resistance level and the bands widen, it indicates higher market volatility and a potential breakout.
RSI
Typically, traders look for RSI crossovers to signal potential trades. But in this case, the indicator can be used to confirm a breakout.
If the price breaks through resistance, confirm the breakout by observing RSI moving from oversold territory (above 30). This tells you that the market momentum is up, and RSI is reflecting the change of the trend. Similarly, if the asset breaks through support while heading downward, youll want to confirm it with RSI that drops below 70 (overbought zone).
How to trade real breakouts

Assuming you want to trade in a range-bound market. Here are the key steps to trading real breakouts in such a market:
1. Identify the range. Look for a market that has been trading in a range between a support and a resistance level.
2. Wait for a breakout. Wait for the market to break beyond either the support or the resistance level, or use technical indicators to determine when the breakout is about to happen.
3. Enter the market. After the breakout, the market is likely to experience increased volatility as traders react to the new price level. This is a good time to enter the market, buying if the breakout is above resistance or selling if its below support.
4. Use a stop loss. Place your stop loss just below support (if youre going long) or just above resistance (for short sellers).
5. Manage your position. If the market continues to move in your favor, you can lock in profits and use trailing stops to ride the trend. However, be prepared to exit the market in the case of a reversal or if the market moves back into the range-bound pattern.
How to avoid false breakouts
False breakouts can be frustrating, and they can also be costly. Here are a few recommendations to improve your analysis accuracy:
• Multiple timeframes – For example, if you identify a potential breakout on the daily chart, consider looking at the hourly or 4-hour chart to confirm it.
• Consider volatility – When the market is quiet with low volatility, it can increase the risk of false breakouts. It may be better to wait for higher volatility periods when trading breakouts.
• Use price action analysis – Look for price action clues like candlestick patterns, chart patterns, etc.
• Go beyond technical analysis – Pay attention to fundamental factors, i.e., the overall health of the economy, political events, and other news that could impact the market.


Read more
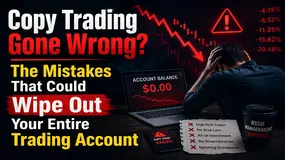
Copy Trading Gone Wrong? The Mistakes That Could Wipe Out Your Entire Trading Account
We all love trading geniuses and their strategies that earn them profits season after season. And we also love following them to make our investment journey seamless. Copy trading is one such tactic that beginners employ to enter the forex market. What do most of them usually do? They pick an experienced investor from the list and let the platform replicate every trade automatically. The fact that experienced traders continually earn profits, the feeling of copying their trades remains intense. However, the uncertain forex landscape can bite you hard by simply copying trades and not focusing on technical analysis and the charts during the day. Beginners can have a set of preconceived notions that can potentially open the gate for losses. In this article, we have highlighted such mistakes traders should avoid.
tegasFX Review: Do Traders Face Illegitimate Profit Deletions & Slippage Issues?
tegasFX, a Comoros-based forex broker, has been reported by many traders as a fraudulent operation. Traders allege that the brokerage house deliberately deletes their profits while blaming them for abusive trading. In addition, some users have accused the broker of excessive slippage draining their capital. If you have been affected by these trading circumstances, you must read this tegasFX review, where we have highlighted allegations made by traders. These comments might resonate with you. Let’s read on!
Effective Stop Loss Trading Strategies
In a forex market where fundamental and technical factors impact the currency pair prices, volatility is expected. If the price volatility acts against the speculation made by traders, it can result in significant losses for them. This is where a stop-loss order comes to their rescue. It is one of the vital investment risk management tools that traders can use to limit potential downside as markets get volatile. Read on as we share its definition and several strategies you should consider to remain calm even as markets go crazy.
Exchange Rate Fluctuations: Key Facts Every Forex Trader Should Know
The forex market is a happening place with currency pairs getting traded almost non-stop for five days a week. Some currencies become stronger, some become weaker, and some remain neutral or rangebound. If you talk about the Indian National Rupee (INR), it has dipped sharply against major currencies globally over the past year. The USD/INR was valued at around 85-86 in Feb 2025. As we stand in Feb 2026, the value has dipped to over 90. The dip or rise, whatever the case may be, impacts our daily lives. It determines the price of an overseas holiday and imported goods, while influencing foreign investors’ perception of a country. The foreign exchange rates change constantly, sometimes multiple times a day, amid breaking news in the economic and political spheres globally. In this article, we have uncovered details on exchange rate fluctuations and key facts that every trader should know regarding these. Read on!
WikiFX Broker
Latest News
21 Arrested in Melaka Raid on Fake Stock Investment Call Centre
 WikiFX
Octa Review: Profit Withdrawals, Account Blocks, and Broker Risk Signals
WikiFXSpotting Forex Ponzi Schemes and Confidence Scams Before You Deposit
WikiFXWhat Indian Beginners Should Check Before Choosing a Forex Broker
WikiFXINVESTIZO Review: Unregulated Broker Under Fire Over Withdrawals and Profit Cancellation
WikiFXBuild Trading Discipline Using a Bar-by-Bar Blind Test
WikiFXBreak the Habit of Adding to Your Losing Trades
WikiFXBehind the Regulated Facade: Is ACCUMARKETS Freezing Out Successful Traders?
WikiFXFBS Review: CySEC & ASIC Licensed, Yet Scored 2.51 , What's Really Going On?
WikiFXIpoh Businessman Loses RM1.25 Million in Crypto Group that Promised High Returns
WikiFXRate Calc

