Hammer candlestick pattern: a strategy guide
Abstract:In the 16th century, in England, there was a law that required every homeowner to own a hammer. With this law in place, in case of a fire, every citizen had the necessary tools to help put out the flames. Imagine if every trader had to use a hammer strategy in case of market fluctuations.

In the 16th century, in England, there was a law that required every homeowner to own a hammer. With this law in place, in case of a fire, every citizen had the necessary tools to help put out the flames. Imagine if every trader had to use a hammer strategy in case of market fluctuations.
Like a real-life hammer, this strategy can help a trader to achieve their goals and navigate difficult situations. So lets investigate it together.
What is the hammer pattern?
(The 10 best candlestick signals)
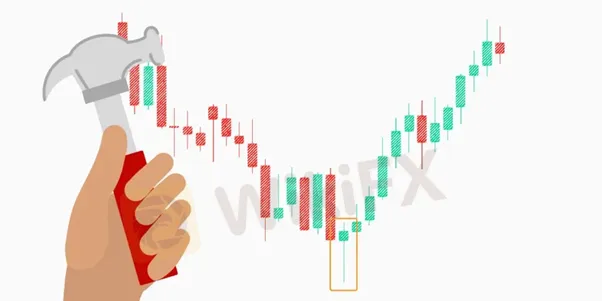
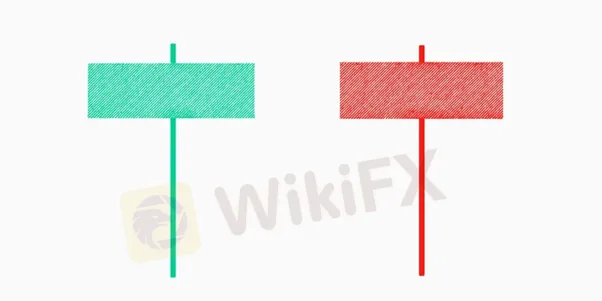
The hammer pattern describes a bullish reversal pattern. Its called a hammer because the candlestick pattern looks like a hammer, with a small body and a long lower shadow. The shadow represents the price range between the low and the closing or opening price depending on the price direction, and the body represents the price range between the open and the close.
The hammer pattern occurs when an asset opens, trades lower during the day, but then rallies to close not far from its opening price. This indicates that buyers stepped in to support the asset and that the selling pressure may be over. For traders, its a signal that the asset may be ready to reverse its trend and start moving higher.
As for the hammer‘s history, it’s not associated with any one person who noticed it. It is just one of many candlestick patterns that are used to identify potential trading opportunities based on price action and chart analysis.
Hammer and inverted hammer candlestick pattern
The inverted hammer candlestick looks similar to the hammer pattern, but it‘s upside down—a small body, a long upper shadow, and a short lower shadow. It’s also formed at the bottom of a downtrend.
The top part of the candlesticks long shadow appears when the bulls push the price up. But the bears (or short-sellers) show some resistance, causing a small body to be formed at the bottom. In the end, the bullish trend proves too strong, and the market settles at a higher price.
There is no such thing as the inverted hammer candlestick pattern at the top, as its still a signal of potential bullish reversal.
Hammer and hanging man
To avoid repeating what‘s been said, let’s focus on the hanging man. It‘s a bearish reversal pattern that is formed at the top of an uptrend. The candle can be both bullish and bearish. It just needs to have a small body, which is at least twice shorter than a lower shadow. The lower shadow shows that bears were strong enough to take control of the market for a period. This pattern suggests that the buying pressure has weakened. The uptrend may be losing momentum, potentially signaling a shift toward a bearish trend. If you’re bullish on an asset, consider it a warning sign.
While the hammer and hanging man have similar shapes, the key difference is in their position relative to the trend.
How to read the hammer pattern
Remember that you cant see the hammer candlestick pattern in an uptrend, but if you see it formed at the bottom of a downtrend, perhaps you should be preparing for a reversal. But how can you be sure? Well, if you want to be more confident, here are the steps to read the pattern:
Look for a small body.
The difference between the open and close prices is small, the selling pressure has weakened, buyers are starting to step in.
Look for a long lower shadow.
The difference between the low and the close/open price is large, the asset traded lower during the period, buyers stepped in, pushing it higher.
Look for confirmation.
Before taking the hammer pattern as a definite sign of a bullish reversal, confirm the signal. For example, you might look for other bullish indicators, such as a moving average crossover or an increase in trading volume.
How to trade with the hammer
Now, it‘s time to see what the hammer is capable of in practice. There are multiple strategies that use the hammer pattern effectively, but let’s only focus on three:
Top-bottom strategy
When using the hammer pattern in this strategy, the first requirement is to identify a strong downtrend that has broken all near-term lows. This could be evidence that the market is oversold and due for a potential reversal. All in all, this strategy seeks to identify significant turning points in the market.
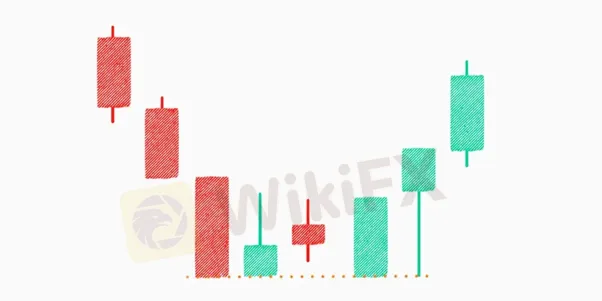
Let‘s say you’re trading a stock, and the price moves lower and breaks below the near-term low. However, it shows the first sign of upcoming bullish pressure with an indecision candle, followed by a bullish hammer.
To trade with the hammer pattern using the top-bottom strategy, place a buy order above the hammers high price. You can set the stop loss below the shadow, and make sure to leave some wiggle room to allow for potential market fluctuations.
Support-resistance trading
Support and resistance levels are key concepts in technical analysis, and they represent areas where the price has historically had difficulty moving past or below. The market usually turns around at such levels. Now, here is where this topic intercepts with the hammer.
Lets say you see that the price has been decreasing and now is approaching a solid support level, this gives you a signal that bullish pressure may be on the horizon.
Although the bears try to push the price lower, they are met with resistance from buyers. The bears fail to take the price lower, and the candle closes with a bullish hammer, another thing pointing to bullish pressure. Sometimes, there is a doji candle before the hammer, this is the first sign of upcoming bullish pressure
If you have noticed a growing bullish demand in the market, consider taking advantage of it by placing a buy order above the hammers high price. Arrange some protection for yourself with a stop loss below the shadow and some breathing space.
Intraday trading with moving average
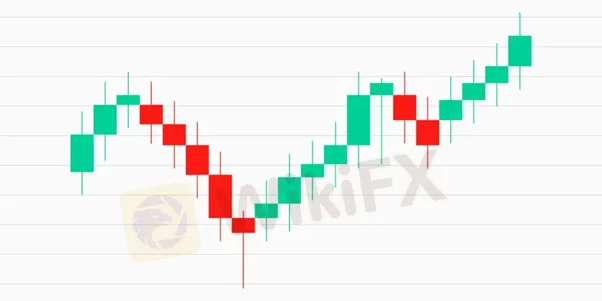
The first step is to identify the overall market trend, which, in this case, should be bullish. There may be bearish corrections when sellers decide to take profits from their investments, causing a temporary dip in prices. But in most cases, buying pressure may resume after this period after the temporary bearish correction.
The strategy suggests using the dynamic 20 EMA as a minor support level to gauge the market sentiment. If the price of the asset bounces off, the reasonable conclusion is that buyers are entering the market, and it could be a potential buying opportunity.
Moreover, if the price is moving along with the EMA, you can assume that the market sentiment is bullish. In this case, any rejection from the EMA could be an opportunity to buy the asset as the price may continue to move higher.
Place a buy position at the high of the hammer candlestick and set a stop loss below the shadow of the candlestick. This will minimize the risk exposure in case the market turns unfavorable.


Read more
TDFX Review: An In-depth Report Into Issues Concerning Withdrawals, Slippages & Fund Transfers
Failed to withdraw your funds successfully from the TDFX platform? Did the Australia-based brokerage firm illegitimately take away your trading profits? Have you witnessed losses on the broker’s trading platform due to heavy slippage? Did you also struggle transferring your funds from the TDFX trading account? You are not alone! These allegations have somewhat degraded the rating of the forex broker. Through this TDFX review article, we aim to investigate user complaints so that you can decide whether this trading enterprise is right for you. Keep reading to find our analysis.

Close Up With WikiFX - A Closer Look at InterStellar Group
With the rapid growth of the global multi-asset investment market, the disparities in the forex industry across different regions have become increasingly evident. As a forex broker information service platform operating in over 200 countries and regions, WikiFX is committed to helping investors in each region identify reliable brokers. Therefore, WikiFX launched a series content — Close Up with WikiFX, which offers in-depth interviews with local brokers. Leveraging WikiFXs robust big data system and industry insights, the series aims to help investors gain a deeper understanding of high-quality brokers. In this exclusive interview, we had the opportunity to speak with Konstantinos Theodorou, CEO of InterStellar Group-Cyprus, to explore the company’s operations and market insights.
InteractiveBrokers Review: Are You Facing Withdrawal & Deposit Issues? You Must Read This!
InteractiveBrokers, a Hong Kong-based forex broker with over two decades in the trading space, has been facing ire from traders worldwide. Some allegations are just a week old from today, making it imperative for all of us at WikiFX to highlight them. Allegations primarily center on withdrawals and deposits, with some even criticizing the broker for its poor customer support service. So, if you are also among the affected ones or are willing to invest here, you must read this InteractiveBrokers review article. Here, we have examined these allegations against the forex broker.
Herofx Regulation & License Status: A 2026 Deep Dive into the Risks
When choosing a forex broker, the most important question is about its regulatory status. For Herofx, the answer is straightforward and critical for any potential trader to understand: Herofx is an unregulated broker. While the company, Hero FX Ltd, is registered in the offshore location of Saint Lucia, this business registration provides none of the financial oversight or client protection that comes with a license from a trusted financial authority. This difference is the main risk involved. This article provides a detailed, fact-based analysis of the Herofx regulation status, its company structure, a breakdown of documented user experiences, and a clear explanation of the serious dangers traders face when dealing with an unregulated company. The evidence suggests a high-risk environment where trader capital is not protected by standard industry safeguards.
WikiFX Broker
Latest News
India’s Love Affair with Gold: Investment Demand Rises 40% of Consumption in CY25
 WikiFX
Why Paid Forex Signals Are a Trap for Beginners
WikiFXUS Dollar Dips On Hormuz Proposal
WikiFXZed Capital Review 2026: Should You Trade With This Broker?
WikiFXIs Naga Regulated? Guide to Naga Regulation and Safety
WikiFXThe MSquare Review: Forged Blockchain Receipts, Frozen Accounts, and Severe Anomalies Exposed
WikiFXHow Trading Volume Tells You If a Price Move is Real
WikiFXWhy Judging Trades by Profit Teaches the Wrong Lesson
WikiFXEC Markets Reports Record $5.13 Trillion Q1 Volume in 2026
WikiFXWhen Scammers Forge a Minister's Signature: Malaysia's Fake Investment Letter Exposed
WikiFXRate Calc

