Mixed signals
Abstract:Markets are sending conflicting signals about how big a threat the global trade rift presents.
Markets are sending conflicting signals about how big a threat the global trade rift presents. Markets sent mixed signals on 23rdMarch. Dow stocks seesawed back and forth in a rather directionless trading day while Nasdaq gained. The yield-sensitive technology stocks traded higher as investors believed the Fed can‘t keep hiking rates and risk further panic and bank runs. Bonds didn’t gain much supporting the dollar. As a result, EURUSD created a bearish shooting star candle (indicates momentum loss). This didnt slow down the gold bulls though as they see the potential end of tightening as a reason to prepare for higher inflation. During times of high inflation gold has traditionally acted as a hedge against rising prices.
The BOE hiked by 25 bp as expected so there was no significant market reaction in Cable. The central bank did indicate earlier that it might pause the hikes, but a sudden pickup in inflation in February forced the BOE to increase the borrowing costs at least once more. Andrew Bailey the BOE governor said, “We believe that inflation will begin to fall quite rapidly before the summer, but as yesterdays release for February showed, we need to see that happening”.

Lower high in NAS
NAS trades near a recent daily swing high. If the market starts breaking supports it could lead to a formation of bearish double-top formation. Yesterday‘s high created a lower swing high in the 4h chart and so the risk of the market breaking below 12 543 has increased. If the level breaks a move down to 12 400 looks likely. A decisive break above yesterday’s high would probably open a way to 13 200 or so.
Gold trades near recent highs
Gold trades near recent highs and has started to react lower. This is likely due to the strength of the USD. The nearest support is at 1966. If its violated the 1934 level probably gets tested. On the other hand, above 2010 gold could trade to 2030.
Bearish shooting star in the daily EURUSD chart
EURUSD turned bearish after a strong rally. The market has retraced back to 1.0760 but I dont think the market can turn bullish here (the probabilities of a new uptrend starting from here are low) as the market has just turned bearish. If the 1.0760 is broken decisively, EURUSD probably trades down to 1.0724.

USDZAR trades near to a support area
The U.S. dollar (USD) / South African rand (ZAR) exchange rate (ticker symbol: USDZAR) has become one of the most popular exotic currency pairs among global forex traders. USDZAR trades higher from a daily support area. If the market can rally decisively above the 18.20 level, a move to 18.60 could be in the cards. Below 18.00 a move to 17.70 level looks likely.


Read more
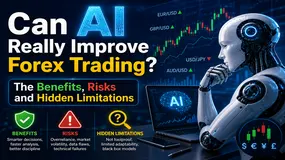
Can AI Really Improve Forex Trading? The Benefits, Risks and Hidden Limitations
We are living in the age of artificial intelligence, where everything including financial matters such as forex are rapidly influenced by this phenomenon. AI-powered tools are here to identify numerous trading opportunities and analyze thousands of data, all in seconds, becoming the preferred option for both retail and institutional traders. Regardless of its immense benefits, traders often question - Whether the AI can truly transform their forex trading experience or is it just like another technology offering scope for unrealistic expectations? While the AI can ensure faster trading and more informed decisions, it is never a sure shot way to profits. As a trader, you need to understand both the strengths and limitations of AI when it comes to generating real wealth.
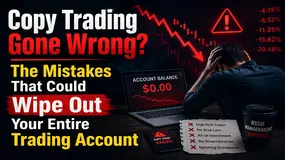
Copy Trading Gone Wrong? The Mistakes That Could Wipe Out Your Entire Trading Account
We all love trading geniuses and their strategies that earn them profits season after season. And we also love following them to make our investment journey seamless. Copy trading is one such tactic that beginners employ to enter the forex market. What do most of them usually do? They pick an experienced investor from the list and let the platform replicate every trade automatically. The fact that experienced traders continually earn profits, the feeling of copying their trades remains intense. However, the uncertain forex landscape can bite you hard by simply copying trades and not focusing on technical analysis and the charts during the day. Beginners can have a set of preconceived notions that can potentially open the gate for losses. In this article, we have highlighted such mistakes traders should avoid.
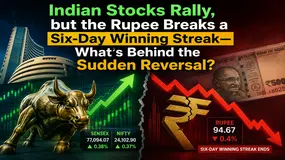
Indian Stocks Rally, but the Rupee Breaks a Six-Day Winning Streak—What's Behind the Sudden Reversal
Indian stock indices today, i.e., June 22, 2026, recorded growth, with the BSE Sensex rising 297.11 points to 77,094.07, recording a 0.38% jump. On the other hand, the NSE Nifty hit approximately 24100, largely aided by broad-based purchases across sectors, except for consumer durables and fast-moving consumer goods (FMCG). The Nifty grew by 89.80 points (0.37%+) to 24,102.90.
ALFX Review 2026: Fast Withdrawals, Easy Deposits—Reality or Hype?
ALFX, a new-age brokerage firm with around two years of service track record, seemed to have recorded around 30 reviews by users worldwide, including those in India. While some question the deposit & withdrawal process based on their poor experience, some appreciate its smooth payment services and impressive spreads. This ALFX review article takes both positive and negative user feedback for the broker. This will allow you to make an informed financial decision.
WikiFX Broker
Latest News
OROKU EDGE Review 2026: Blacklist Warnings, Withdrawal Complaints, and High Leverage
 WikiFX
Reading the Market Weather: How to Identify Forex Trends and Ranges
WikiFXUsing Volatility and ATR to Fix Your Forex Stop Loss
WikiFXPIPS STAR Review 2026: Unregulated Status and What Indian Traders Should Check
WikiFXHousewife Loses RM250,000 Life Savings to Ghost Investment Scheme Promising 10% Returns
WikiFXIs It Your Fault for Falling for an Investment Scam?
WikiFXDeltaFX Review 2026: My MT5 Account Was Locked During Trade. Did the Trader Lose Everything?
WikiFXCan AI Really Improve Forex Trading? The Benefits, Risks and Hidden Limitations
WikiFXVITTAVERSE Review 2026: Offshore Regulation and Withdrawal Complaints
WikiFXSaxo Bank Review 2026: Regulation, Clone Risks, and Trading Costs
WikiFXRate Calc

