Oil Continues Bearish as Geopolitical Uncertainty Eases
Abstract:The “Russian-made” missile that exploded in Poland has been reported to originate from Ukraine.

The “Russian-made” missile that exploded in Poland has been reported to originate from Ukraine.
What You Need To Know
Oil continued its steep selloff, tumbling to the lowest in more than six weeks as demand concerns resurface over demand concerns as geopolitical risk resulting from a Russian-made missile exploding Poland eased. There is no indication that said missile was from Russia, easing fears of further escalation. The Druzhba pipeline is back in service after a power disruption earlier, while surging China Covid-19 cases have also dampened oil demand. After the Fed reiterated to tighten the policy further to meet their inflation target, the U.S. yield curve has its most extreme inverted curve in 4 decades, which indicated the market is concerned about the risk of recession.
Look Out For
Current rate hike bets on 14th December Fed interest rate decision:
75 bps (19.4%) VS 50 bps (80.6%)
Market Movement

USDX

The Dollar Index was trading flat, buoyed by the mixed market sentiment towards US economic progression. On the positive front, the Greenback received some bullish momentum yesterday over the backdrop of stronger-than-expected US retail sales data. According to the Census Bureau, US Core Retail Sales for last month increased significantly from the previous reading of 0.1% to 1.3%, exceeding the economist forecast of 0.4%. The upbeat economic data suggests that solid consumer spending could help to underpin the economy in the fourth quarter.
The Dollar Index is trading lower while currently testing the support level at 106.15. Nonetheless, MACD has illustrated increasing bullish momentum, while RSI is at 35, suggesting that the index was going into oversold territory.
Resistance level: 107.80, 109.65
Support level: 106.15, 104.75

XAU/USD
The gold market retreated slightly after testing the weekly high around $1785 on Wednesday following the easing geopolitical tensions between Russia and Ukraine, which spurred risk-on sentiment in the global financial market while dragging down the appeal for safe-haven gold. Meanwhile, yesterdays upbeat retail sales data from the United States continue to weigh on the dollar-denominated gold. As for now, market participants will continue to scrutinise the latest updates regarding the rate hike decisions from the Fed and the development of the Russia-Ukraine war to gauge the likelihood trend for the commodity.
The gold market is trading within a range while currently testing the support level. However, MACD has illustrated increasing bearish momentum, while RSI is at 61, suggesting the golds outlook could become bearish in the near-term as the RSI retreated sharply from overbought levels.
Resistance level: 1809.25, 1854.60
Support level: 1770.35, 1727.20

EUR/USD
The euro rebounded from its lower level yesterday, buoyed by news of a possible easing of geopolitical concerns after Poland and NATO group claimed on Wednesday that the explosion, which killed two people in Poland, was probably a stray missile fired by Ukraines air defence system and not an intentional Russian strike. Poland has claimed that the missile was probably an old S-300 rocket, a Soviet-era missile system used by Russia and Ukraine.
EUR/USD is trading lower following prior retracement from the resistance level. MACD has illustrated increasing bearish momentum, while RSI is at 44, suggesting the pair will likely extend its losses toward support level since the RSI is below the midline.
Resistance level: 1.0440, 1.0590
Support level: 1.0300, 1.0190

BTC/USD
A higher-than-estimated U.S. retail sales report shows that consumer and business spending remained strong. This, however, will give the Fed more confidence to keep on track with their monetary tightening policy, leading to a stronger dollar. With investors still uncertain about the aftermath of the fall of FTX, a stronger dollar will definitely put pressure on BTC.
In technical analysis, the MACD has stopped climbing just under the zero line and the RSI keeps hovering near 50-level suggesting that the market is now lacking direction. The low trading volume after last weeks plunge shows that investors may be in a “wait-and-see” mode.
Resistance level: 17424, 18450
Support level: 15960
DJ30
The Dow Jones has lost its bullish momentum especially after the U.S. commerce department released stronger-than-expected retail sales data. High spending from businesses and consumers has given greater confidence to the Fed to continue its hawkish monetary policy. A higher interest rate would definitely not be friendly to the equities market.
The index is suppressed by its strong resistance level at 33955, which has just hovered beneath the level since last week. The MACD has been dropping and is approaching the zero level depicting a slowdown in bullish momentum for the index. The RSI has also flowed near to 50-level from the overbought zone suggesting that the bullish momentum is halted.
Resistance level: 33955, 34650
Support level: 32870, 32005

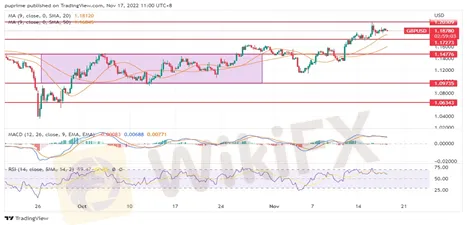
GBP/USD
The pound remained on the positive sidelines yesterday. Markets are now awaiting Chancellor Jeremy Hunts upcoming Autumn Statement later today. The energy sector would be the main focus, and Hunt will aim for popular policies like increasing taxes on energy companies. Therefore, the pair would be volatile in reaction to the speculation on what will be announced.
The pair is trading at 1.18 as of writing. MACD has illustrated the pair remain on the bullish sidelines. At the same time, RSI is trading around 57, indicating a bullish momentum ahead in the short term.
Resistance:1.200, 1.2200
Support: 1.1727, 1.1477

USD/JPY
The pair hovers from 137.5 to 140.6 as Japan‘s trade deficit increases in October. Weakness in the currency inflated the country’s import bill, which drove up the energy costs and inflation rates, impacting both households and companies. Investors can focus on the upcoming core consumer price index in Japan, which will be announced on Friday, and is expected to be higher than 3.5%.
The pair dropped to its 2-month low and is now trading at 139.6 at the time of writing. The MACD line has illustrated a bearish momentum in the short term. While RSI is trading at 42, it is near the oversold zone but suggests that the pair would hover within bearish momentum.
Resistance level: 140.60,145.045
Support level: 135.16, 131.36

CL OIL
Oil market edged lower yesterday after the Druzba pipeline restarted, weighing on the fears of supply disruption. Meanwhile, crude oil prices extended their losses as tensions between Russia and Ukraine faded, following Poland and NATO claiming that yesterday‘s deadly missile strike was probably unintentional. In addition, rising Covid-19 cases in China after the country eased some virus restrictions last week have continued to weigh on crude oil’s market demand. According to the National Health Commission, China recorded 20,199 new Covid-19 cases on 15th November, much higher than 17,909 new cases a day earlier.
Crude oil prices are trading lower while currently testing the support level. MACD has illustrated increasing bearish momentum, while RSI is at 40, below the midline, suggesting the commodity to extend its losses after successfully breakout below the support level.
Resistance level: 89.75, 92.60
Support level: 85.25, 83.05


Read more
octa Review 2026: Is There an End to My Endless Failed Withdrawal Requests? We Examined This Claim
octa, a Cyprus-based brokerage company, continues to face a common question from traders: when will my withdrawal requests be successfully processed? Maybe not literally, but contextually, it is allegedly the issue many traders have reported on broker review platforms such as WikiFX. Regardless of the trader’s region, be it South Asia, Indonesia, Brazil or any other, most traders have expressed their concerns over the alleged withdrawal delays or denials. In this octa review, we have examined several user allegations concerning withdrawal issues and other problems encountered on the platform.

Why Is My Forex Withdrawal Still Pending? 7 Broker Excuses Traders Keep Hearing
Withdrawal delays are precisely the complaint we keep receiving on WikIFX, a veteran in the forex regulation inquiry space. While some users receive withdrawal access initially and find rejections on their applications later, some fail to receive a single approval. Some delays usually result from genuine compliance requirements that brokers need to adhere to. However, in many cases, traders have accused the broker of repeated excuses as part of its alleged strategy to deny a seamless fund release. A pending withdrawal cannot be an outright indicator of fraudulent activity. Financial institutions, including forex brokerage entities, need to abide by the anti-money laundering (AML) and Know Your Customer (KYC) regulations. However, as the monitoring process stretches beyond weeks or months, traders become frustrated and raise questions over the broker’s reliability.
IQ Option Review 2026: Am I Supposed to Deposit Only? What About My Withdrawals?
This is what many traders are asking while trading with IQ Option, an Antigua and Barbuda-based brokerage entity. Their wrath is evident through massive negative reviews on several broker review platforms. WikiFX, a widely recognized forex broker regulation inquiry tool, itself recorded over 120 complaints from users worldwide. The complaints largely highlight the alleged withdrawal denial by the broker. Users have deposited millions but allegedly failed to withdraw funds when they needed to. While they may just be allegations and not an established fact, they are worth looking at, considering a large volume of complaints pointing to a potential investment scam. In this IQ Option review 2026, we have examined several complaints while providing an overview of the company’s regulatory framework.

JKV Review 2026: The Broker Claims Transparency & Regulation, Traders Report Fund Losses
This is one of the key concerns raised by most users who have claimed trading experiences with JKV Global, a Mauritius-based brokerage entity. These concerns question the broker’s claim of 100% transparency and regulated trading environment. In one of the JKV reviews, a client reported a fund loss as high as $24,800. Amid emerging trading complaints, it was imperative to have a thorough investigation of this broker. In this article, we have not only investigated real user claims but also given you a look into its offerings and regulation status.
WikiFX Broker
Latest News
Escaping the Lag: How to Read Moving Averages and Spot Real Trend Reversals
 WikiFX
Forex Basics for Beginners: Choosing Accounts, Understanding Spreads, and Spotting Breakouts
WikiFXPocket Option Review: Complaints, Regulation Gaps, and Account-Blocking Risks
WikiFXsquaredfinancial Review: Regulation, Complaints, and Withdrawal Risk Signals
WikiFXTrive Review 2026: Complaints, Withdrawals, and Risk Signals
WikiFXWhy Scam Victims Must Not Wait | Get Your Chance to Fight Back
WikiFXNew Scam Tactic Alert: That Financial News Article You Just Read Could Be a Trap!
WikiFXZenstox Review: Withdrawal Complaints and Offshore Regulation Put This Broker Under Pressure
WikiFXForexDana Review 2026: Unregulated Status and Deposit Complaints
WikiFXWholesale prices unexpectedly declined 0.3% in June on big drop in gasoline
WikiFXRate Calc

