How to read forex trading charts
Abstract:Charts are the main tools for technical analysis. Charts are using to plot a sequence of prices and price movements of an asset on certain of duration. It is just a graphical way of showing how the stock prices have performed. Chart has an x-axis called horizontal axis and a y-axis called vertical axis. Generally y-axis represents the price and the x-axis represents the time. A chart always represents the history of the volume of trading in an asset.
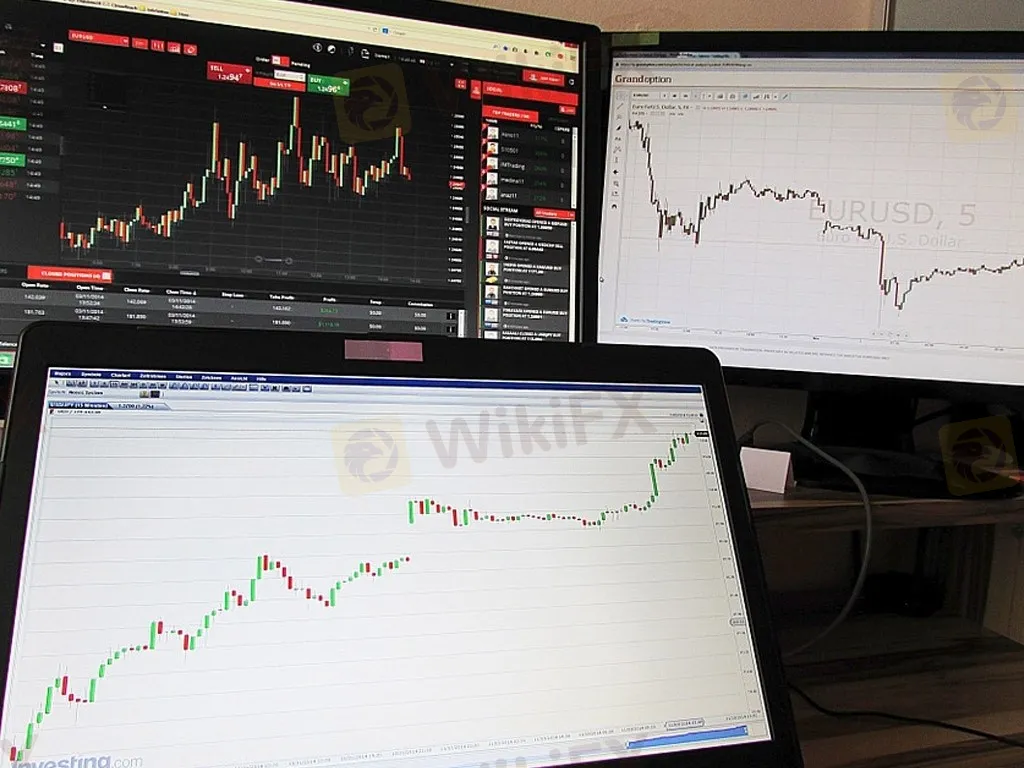
Charts are the main tools for technical analysis. Charts are using to plot a sequence of prices and price movements of an asset on certain of duration. It is just a graphical way of showing how the stock prices have performed. Chart has an x-axis called horizontal axis and a y-axis called vertical axis. Generally y-axis represents the price and the x-axis represents the time. A chart always represents the history of the volume of trading in an asset.
Types of Charts
In chart, asset price comes such as stock, currency pair, commodity like so on in many varieties. It helps to understand in a quick way for individual traders or investors to choose one type over another. Charts are used for the following purpose:
• Comfort and Familiarity
• User-friendly and quickly identified
• Underlying purpose
There are different types of charts by using into the forex signals, we should go one by one and summarized with the following:
Tick Charts
Tick charts have a data point which drawn every time while the market moves or ticks. It means there is no certain time axis to a tick chart; it is just a short term trader just focus on the price action. In the tick chart you will see red line and blue line, red line shows the offer side similarly a blue line indicates the bid side of the market.
Suppose, when you want to take a look at a tick chart on MT 4, and MT 5, you could do double-click on the relevant currency pair in the Market Watch window to see details.
Point and Figure Charts
This is one of the best popular charts in forex trading that has allows:
• to filter exchange rate moves,
• identify clear support and
• Resistance levels as well as trade specific patterns.
This chart allows traders to focus purely on the exchange rate action. Moreover, point and figure charts are typically constructed on graph paper by using an X axis to fill a rising column of boxes and an O to fill a falling column of boxes. Every box represents a specified value that the exchange rate has to attain to justify marking an X or an O on the graph.
Line Charts
Line chart basically connect a set of single exchange rate observations and taken per time period with a straight line. These types of charts mostly used in closing prices and they also could be drawn through high as well as low prices or opening prices instead. A line chart has an x-axis with fixed time intervals.
Bar Charts
Bar chart is very easy to understand that shows the low, high, close and open for every time period by together forms a bar. The high and the low lines are connected with a vertical line with a small horizontal dash is shown at the open level protruding to the left. The closing level is shown by a horizontal dash to the left side. However bar charts have fixed intervals on the x- axis.
It is useful for identifying exchange rate gaps with the range of the first time period does not overlap that of the upcoming period.
Candlestick Charts
Candlestick charts invented by Japanese that offers more information than a bar chart because the color of the candles body signifies when the market increase or decrease in a particular time period.
Take an example, suppose a white body can be used to show a rising or bullish candle whereas a black body can be used to show a falling or bearish candle. The vertical lines are goes between the low and the open and between the close and the high are called “wicks”. Apart from that, some candles have long wicks and others have short wicks and this could be better half when we predicting subsequent behavior in the forex market. Candlesticks charts have predictive value and may be considered chart patterns in their own right so that many of them have colorful names like doji, hanging man, the hammer as well as shooting star.
What is the chart pattern to use when trading?
Chart patterns are important tool for traders that are utilized as part of traders technical analysis. Chart patterns play an integral part while you are looking for market trends and predicting movements for all like new comers as well as professionals. Traders are analyzed markets such as forex, shares, commodities and more.

Read more
Saxo Exposure Report 2026: Withdrawal Delays and Transfer Disputes Leave Traders Concerned
As you look forward to reading the Saxo reviews, you come across both positive and negative user experiences concerning trading. However, what makes prospective users dwell more is the significant insight shared through negative experiences compared to positive ones. The negative experiences are more detailed around fund withdrawals and deposits. Although they are allegations, they represent a disturbing picture. For example, we came across a case where a user highlighted the inability to trade an instrument, which is actively traded in the market. We have examined the recent allegations against the brokerage firm in this in-depth review. At the same time, we have provided a thorough look into the broker’s regulatory framework
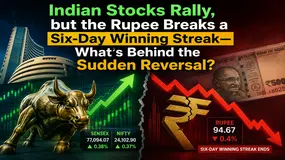
Indian Stocks Rally, but the Rupee Breaks a Six-Day Winning Streak—What's Behind the Sudden Reversal
Indian stock indices today, i.e., June 22, 2026, recorded growth, with the BSE Sensex rising 297.11 points to 77,094.07, recording a 0.38% jump. On the other hand, the NSE Nifty hit approximately 24100, largely aided by broad-based purchases across sectors, except for consumer durables and fast-moving consumer goods (FMCG). The Nifty grew by 89.80 points (0.37%+) to 24,102.90.

RoboForex Review 2026: Are Traders Losing Sleep Over Missing Funds? Details Inside!
RoboForex, a Belize-based forex broker, has been gaining traction not only due to its products and services but also massive user allegations, especially regarding fund withdrawal access. Users worldwide have reported their frustration over alleged missing funds, withdrawal denials, and a complete lack of customer support service online. If you are one of its clients and have faced similar issues, this article is meant specifically for you! In this RoboForex review article, we have examined several user-reported allegations. Additionally, we examined its regulatory status and regulatory scope. This helps provide a clearer picture of RoboForex.
Low Latency Trading: The Milliseconds That Can Make or Break Your Profits
Time is precious, more so in forex trading, where a millisecond delay can either make your winning position turn into a regretful loss or cut short your profit so much that it feels like a loss. While going through numerous user reviews, we often come across the disappointing experiences of slippage draining out their profits due to slow trade order execution. In this article, we have elaborated on low latency, its impact on your trading experience, a host of factors that determine it, etc.
WikiFX Broker
Latest News
Review 2026: Dollars Markets Complaints, Withdrawals, and Regulation Risks
 WikiFX
Vonway Forex Review 2026: Withdrawal Complaints, Regulation Warnings, and Account Risks
WikiFXStructuring a Practical Forex Trading Plan and Stop-Loss Strategy
WikiFXUbuntu Invest Review 2026: Is This Forex Broker Safe?
WikiFXAlpari Review 2026: Complaints, Warnings, and Risk Signals
WikiFXSquaredFinancial Review 2026: Heavy Complaints, Withdrawal Delays, and Profit Deletions
WikiFXOver 100 Malaysian Retirees Gather to Expose How Investment Scams Wiped Out Their Life Savings
WikiFXAvaTrade Seeks to Acquire FXCM Operator Stratos
WikiFXIndian Stocks Rally, but the Rupee Breaks a Six-Day Winning Streak—What's Behind the Sudden Reversal
WikiFXRoboForex Review 2026: Are Traders Losing Sleep Over Missing Funds? Details Inside!
WikiFXRate Calc

