FPG BTCUSD Market Report June 26, 2026
Abstract:On the Daily timeframe chart, BTCUSD has recently broken below the key 60,000 level, reaching a low that was last seen around September of last year. As shown on the chart, the bearish trend started f
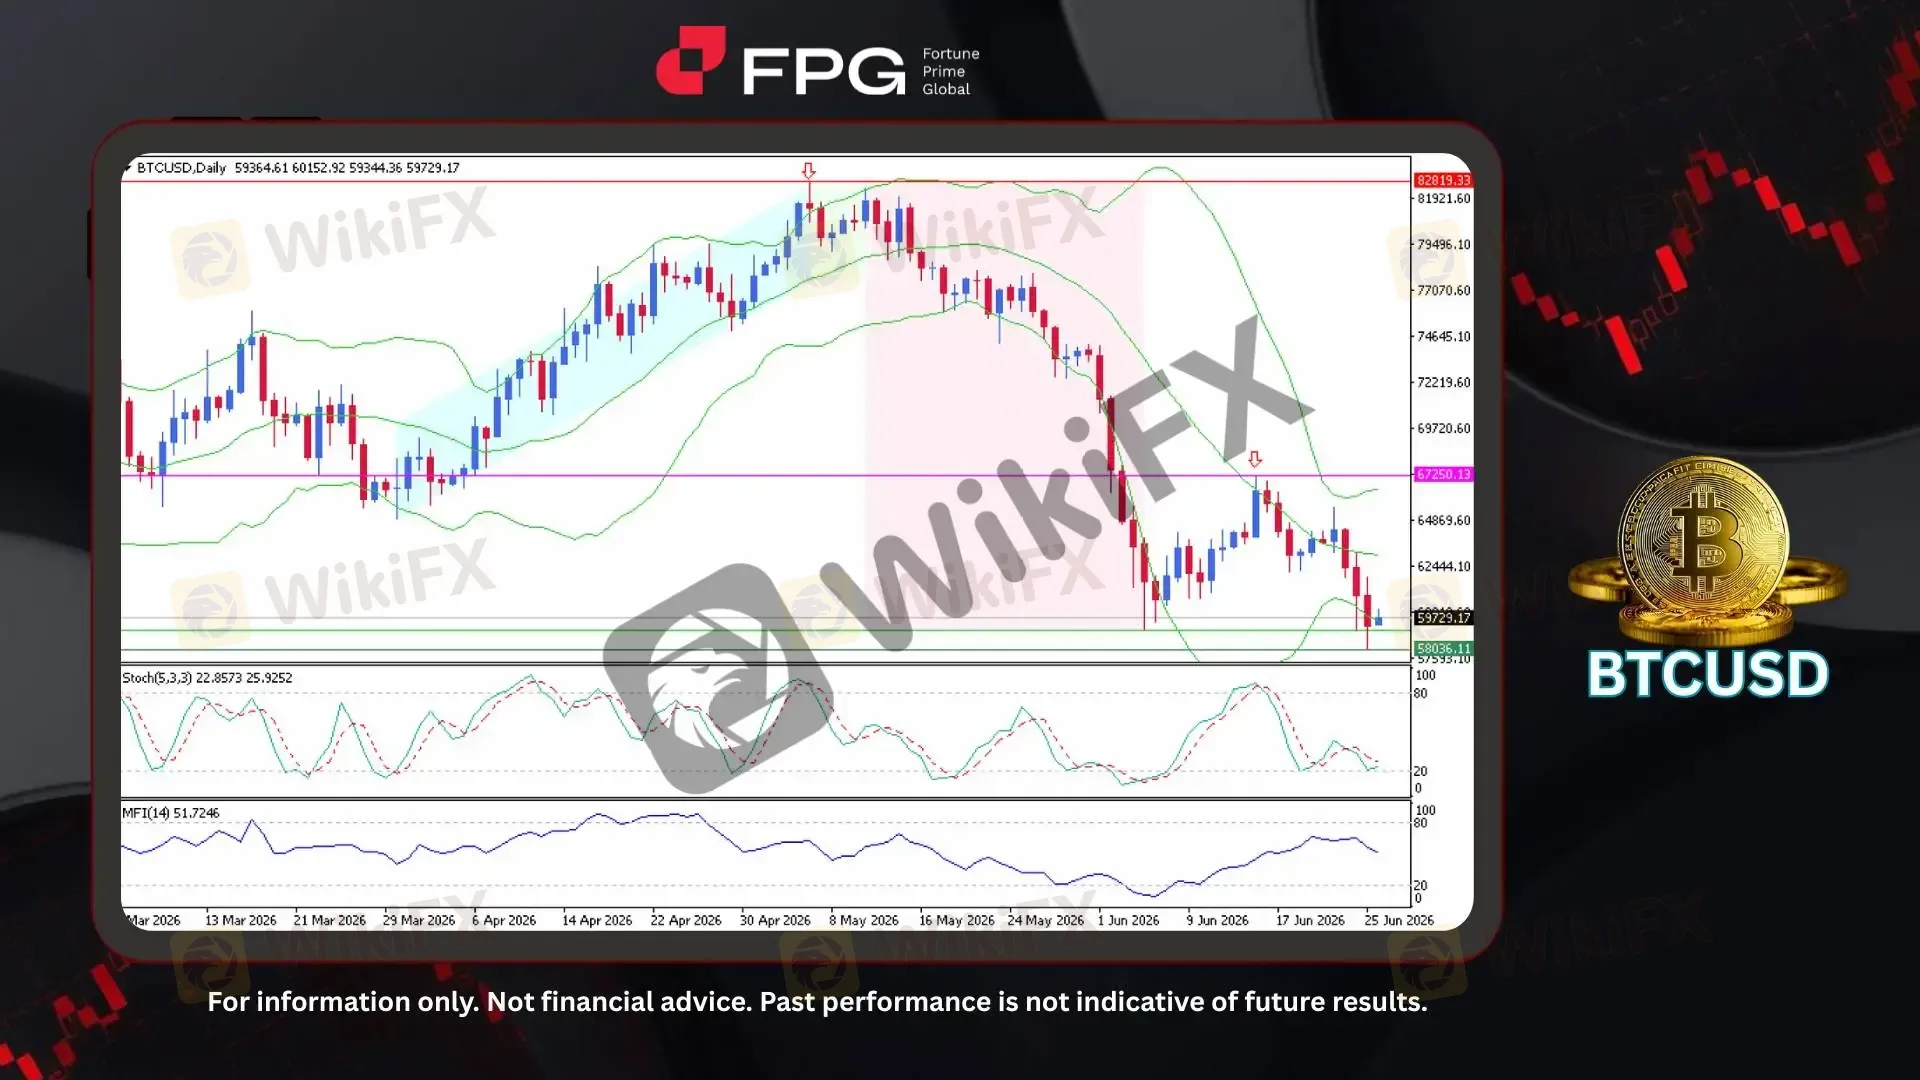
On the Daily timeframe chart, BTCUSD has recently broken below the key 60,000 level, reaching a low that was last seen around September of last year. As shown on the chart, the bearish trend started from the 82,819 resistance area, followed by a consistent series of red candles reflecting strong selling pressure. The price briefly declined to a low of 58,036 before recovering slightly, with the current price trading around 59,729. Volatility is showing signs of increasing again as BTCUSD approaches this important psychological support zone.
From a technical perspective, Bollinger Bands are starting to widen slightly again, indicating that market volatility is gradually increasing after a period of consolidation. The price is currently trading near the lower Bollinger Band, suggesting that bearish momentum remains dominant while the market continues to test the recent support area. The Stochastic indicator is moving within the lower zone, reflecting weaker momentum but also leaving room for a potential short-term rebound. Meanwhile, the MFI indicator remains around the mid-level area, suggesting that capital flow has stabilized but has not yet confirmed a strong recovery in buying interest.
Bitcoin‘s decline below the 60,000 level has been influenced by a combination of macroeconomic pressure, weaker institutional demand, and reduced risk appetite across global markets. Recent concerns surrounding Bitcoin ETF outflows, uncertainty over U.S. Federal Reserve policy, and weakness across risk assets have weighed on investor sentiment. Additional selling pressure from liquidations and cautious market positioning has further accelerated the bearish movement. Fundamentally, Bitcoin’s long-term adoption outlook remains supported, but near-term factors such as liquidity conditions and broader market uncertainty continue to pressure BTCUSD below this key psychological level.
Technical Market Overview
1. Current Position: BTCUSD is currently trading around the 59,729 area after breaking below the key 60,000 psychological level. The price structure remains bearish after declining from the 82,819 resistance zone, with the market now testing the important support area around 58,000–59,000.
2. Resistance Zone: The nearest resistance zone is located around 62,400–67,250, where previous price reactions and recovery attempts have occurred. A breakout above 67,250 would be needed to weaken the current bearish structure and signal stronger recovery momentum.
3. Support Zone: The immediate support zone is positioned around 58,000–59,000, highlighted by the recent low at 58,036. A breakdown below this area could increase selling pressure, while a successful defense may trigger a short-term rebound.
4. Indicator Observation: Bollinger Bands are starting to widen again, indicating increasing volatility, while the price remains near the lower band, reflecting ongoing bearish pressure. The Stochastic indicator is approaching the oversold area, while MFI remains around the mid-level zone, suggesting that buying momentum has not yet fully recovered.
5. Technical Summary: BTCUSD remains under bearish pressure after breaking below the 60,000 level, with the current price movement focused on testing the 58,000–59,000 support zone. The overall trend remains negative as long as the price stays below the resistance area around 67,250. Short-term recovery potential exists if support holds and buying momentum improves, but confirmation of a stronger reversal would require a clear breakout above the key resistance levels.
Market Performance:
Crypto Last Price % Change
ETHUSD 1,567.4 +0.14%
SOLUSD 67.87 +0.38%
Key Economic Calendar:
US: Fed Williams & Goolsbee Speeches
US: Goods Trade Balance Adv
US: Retail Inventories Ex Autos MoM Adv
US: Wholesale Inventories MoM Adv
US: Michigan Consumer Sentiment Final
US: Fed Williams & Kashkari Speeches
Risk Disclaimer: This report is for informational purposes only and does not constitute financial advice. Investments involve risks, and past performance does not guarantee future results. Consult your financial advisor for personalized investment strategies.

WikiFX Broker
Latest News
Ipoh Businessman Loses RM1.25 Million in Crypto Group that Promised High Returns
 WikiFX
ActivTrades Review 2026: Regulation, Complaints, and Withdrawal Risks
WikiFXAligning H4, H1, and M15 Charts for Clearer Intraday Forex Trades
WikiFXBuilding a Forex Strategy: What Beginners Get Wrong About Risk and Chart Patterns
WikiFXRisk Management for Beginners: How Margin and Stop-Losses Prevent Account Blowouts
WikiFXWikiEXPO Hong Kong 2026 Set to Open, Bringing Together Global Leaders in Fintech and Digital Finance
WikiFXTopFX Review 2026: Profits Earned, Account Terminated, Withdrawal Denied? Check This Investigation
WikiFX⚽💱 World Cup · Forex Predict & Win Event
WikiFXBotBro Review 2026: Complaints, Withdrawals, and Risk Signals
WikiFXReading Market Bottoms: Why Support Zones Tell the Real Story
WikiFXRate Calc

