FPG EURUSD Market Report April 27, 2026
Abstract:On the H4 timeframe chart, EURUSD shows a transition from a strong bullish phase into a sustained bearish correction. Price initially rallied from 1.1457 to 1.1848, forming a clear upward structure be
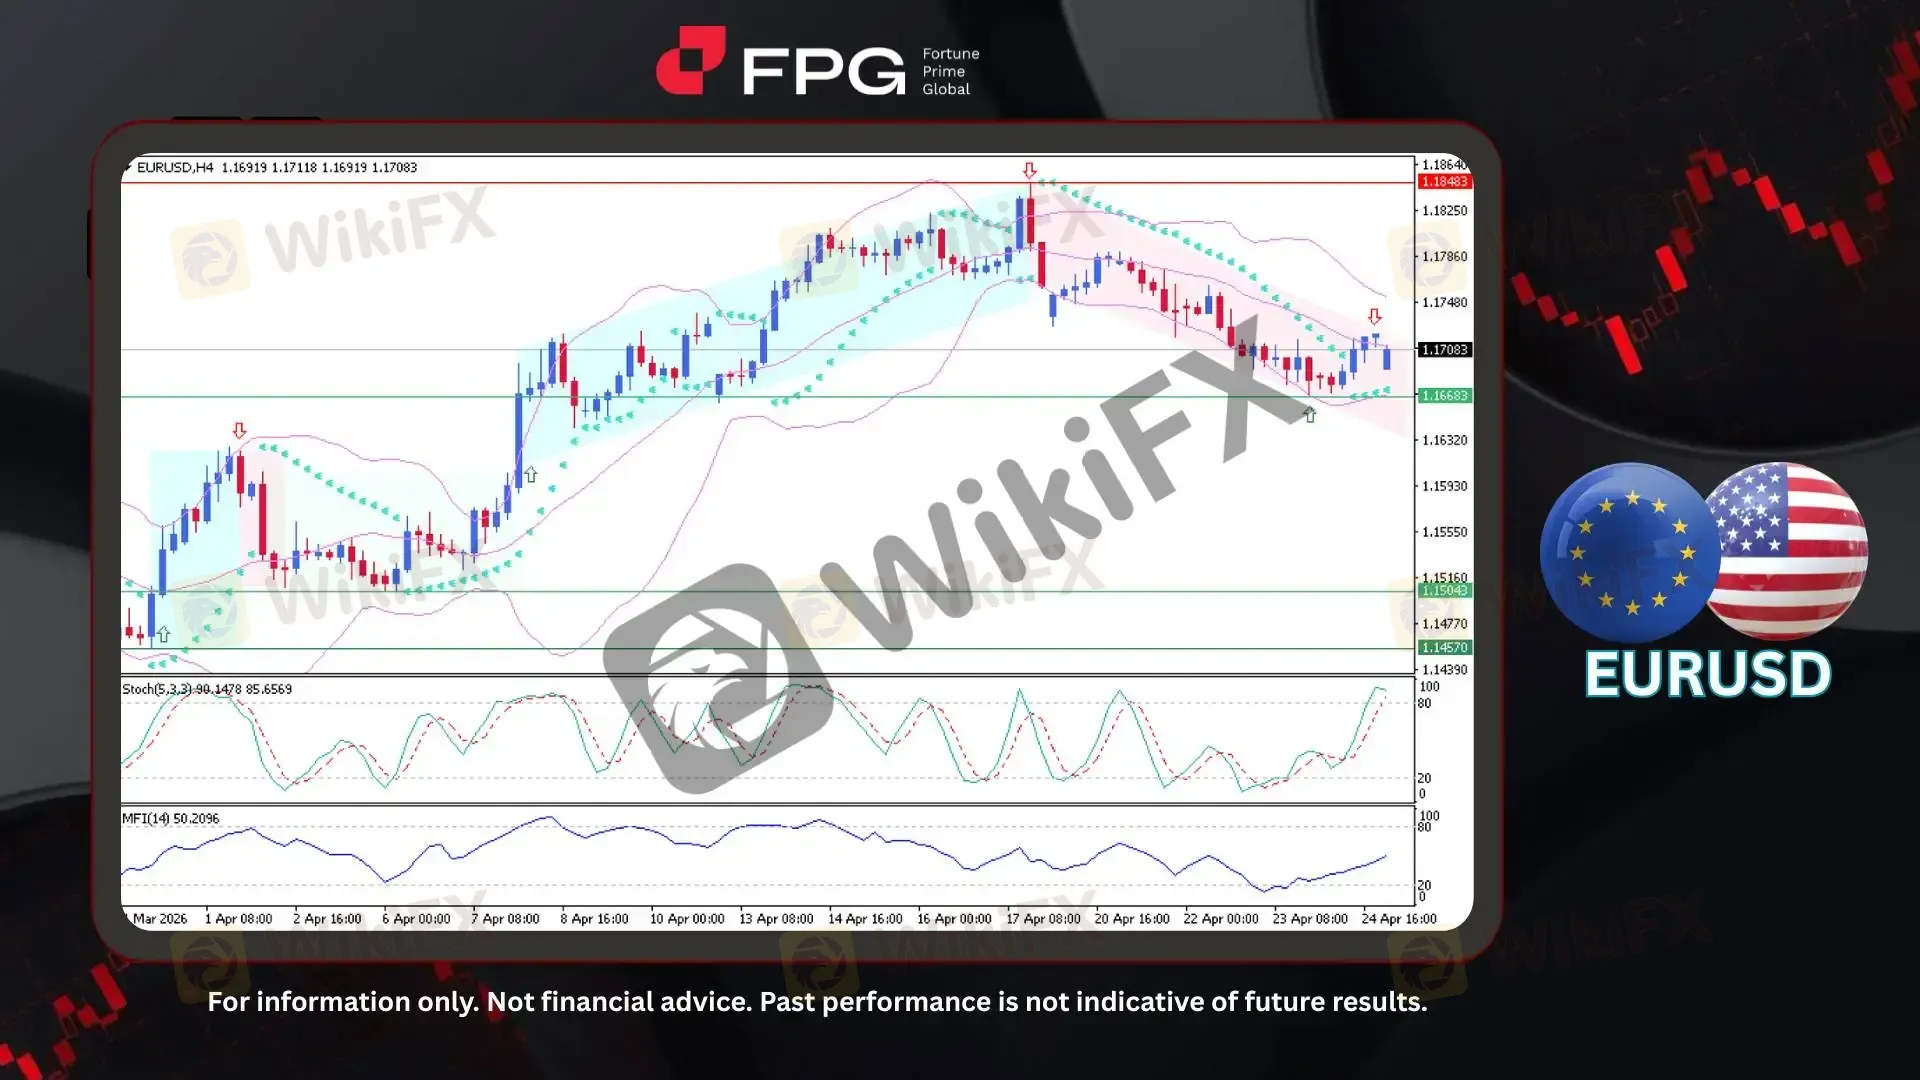
On the H4 timeframe chart, EURUSD shows a transition from a strong bullish phase into a sustained bearish correction. Price initially rallied from 1.1457 to 1.1848, forming a clear upward structure before encountering strong resistance and reversing direction. Following this rejection, the market has developed a consistent bearish channel, marked by lower highs and lower lows. The current price is trading around 1.1708, positioned near the upper boundary of the descending channel, indicating that price is testing a key dynamic resistance level.
From a technical perspective, Bollinger Bands are moderately expanded, reflecting sustained volatility during the bearish move. Price is currently trading near the middle band, suggesting a temporary corrective bounce within the broader downtrend. The Stochastic Oscillator (5,3,3) is in the upper range around 90.15 / 85.66, indicating overbought conditions and increasing the likelihood of a potential downward continuation. Meanwhile, the MFI (14) is around 50.21, reflecting neutral money flow and a lack of strong directional conviction at the current level.
Recent global economic trends show a delicate balance between fiscal support and rising inflation, with U.S. stimulus measures boosting consumption while energy-driven price pressures persist globally. In Europe, weakening PMI data and rising producer costs highlight a slowing economy, putting the ECB in a difficult position between controlling inflation and supporting growth. At the same time, fiscal expansion and higher defense spending are sustaining short-term activity but increasing inflation and debt risks. Overall, stronger U.S. fundamentals and a softer Eurozone outlook have kept EURUSD under bearish pressure over the past week.
Technical Market Overview
1. Current Position: EURUSD is trading around 1.1708, testing the upper boundary of a descending channel.
2. Resistance Zone: The nearest resistance is located at 1.1748, followed by a stronger resistance at 1.1848, marking the recent peak.
3. Support Zone: Immediate support stands at 1.1668, with deeper support at 1.1504, representing previous structural levels.
4. Indicator Observation: Bollinger Bands remain moderate, indicating stable volatility. Stochastic Oscillator (5,3,3) is in overbought territory, while MFI (14) is neutral, suggesting limited buying strength.
5. Technical Summary: EURUSD remains in a bearish structure on the H4 timeframe, with the current upward movement likely representing a corrective bounce. The overbought condition near resistance increases the probability of a continuation to the downside unless a strong breakout occurs.
Market Performance:
Forex Last Price % Change
USD/JPY 159.51 +0.13%
GBP/USD 1.3515 −0.12%
Today's Key Economic Calendar:
CN: National Peoples Congress Standing Committee
DE: GfK Consumer Confidence
UK: CBI Distributive Trades
US: Dallas Fed Manufacturing Index
Risk Disclaimer: This report is for informational purposes only and does not constitute financial advice. Investments involve risks, and past performance does not guarantee future results. Consult your financial advisor for personalized investment strategies.

WikiFX Broker
Latest News
Final Hours for OneCoin Victims: Billions Lost as DOJ Compensation Deadline Looms
 WikiFX
He Promised 15% Returns. Now Over 300 Investors Lost $60 Million.
WikiFXUS-Iran Tension Rattles Indian Stock Markets Today; Still Some Gained in a Gloomy Scenario
WikiFXWhy Your Buy Limit Triggered Three Days Too Late
WikiFXReview 2026: OROKU EDGE Regulation Warnings, Withdrawal Complaints, and High Leverage
WikiFXThe Hidden Drivers of Forex: How Bank Rates and Revaluations Move the Market
WikiFXHow to Measure True Currency Strength Beyond a Single Pair
WikiFXThe Stop Loss Safe Zone: Surviving Breakouts at Key Highs and Lows
WikiFXFXPIG Review 2026: Revoked Regulation and Withdrawal Complaints
WikiFXReview 2026: Webull FSA Regulation, Mobile App Access, and Complaint Signals
WikiFXRate Calc

