U.S. February CPI Cools, but Middle East Conflict Sparks Surge in Costs
Abstract:[Chart 1: U.S. Market Overview]Although the U.S. February CPI data showed inflation cooling to its lowest level in five years, the surge in energy and fertilizer costs triggered by escalating tensions

[Chart 1: U.S. Market Overview]
Although the U.S. February CPI data showed inflation cooling to its lowest level in five years, the surge in energy and fertilizer costs triggered by escalating tensions in the Middle East signals that inflation may rebound sharply in the March data.
On the geopolitical front, President Donald Trump claimed that military operations are “nearing an end.” However, Iran‘s proposed “three conditions for a ceasefire” and Israel’s stated objective of “regime change” reveal a substantial political gap between the two sides regarding the ultimate outcome of the conflict.
The U.S. economic data released today delivered highly contradictory signals:
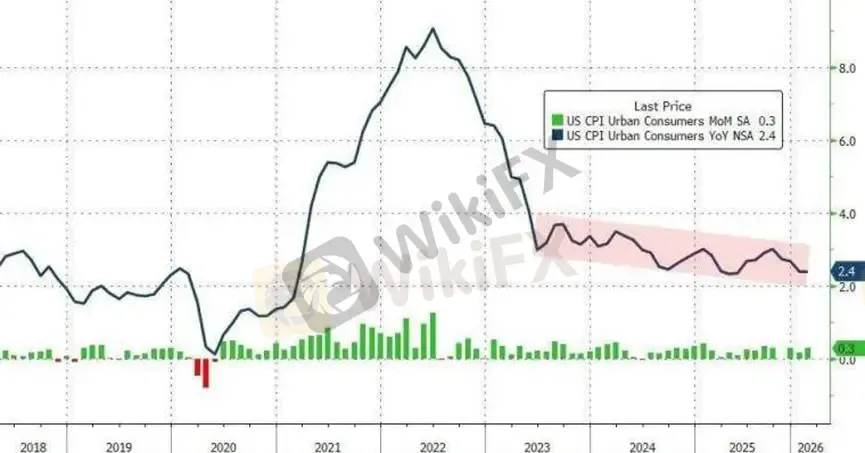
Strong February data: CPI rose 2.4% year-over-year, while core CPI increased 2.5%, marking the smallest annual gain in nearly five years. Under normal circumstances, this would signal a green light for the Federal Reserve to consider rate cuts.
March outlook clouded: Citigroup warns that rising oil prices and fertilizer costs resulting from the Middle East conflict are almost certain to significantly push up March inflation readings.
Federal Reserve stance: Markets widely expect the Fed to keep interest rates unchanged at next weeks FOMC meeting, as geopolitical risks have become the dominant variable shaping U.S. monetary policy expectations.
[Chart 2: U.S. February CPI Data]
Iranian President Masoud Pezeshkian publicly outlined the conditions necessary to end the war for the first time, widely interpreted as a political response to what Tehran describes as the “maximum pressure strikes” by the United States and Israel.
The three proposed conditions include:
Recognition of Irans legitimate rights, including its nuclear development and regional security status.
War compensation, demanding economic restitution from the U.S. and Israel for damages caused by military actions.
International guarantees, calling for firm assurances from the global community to prevent future aggression.
Analysts Summary
Energy (March risk premium): Despite plans by the G7 to release strategic reserves and Trumps proposal to reduce U.S. strategic petroleum stockpiles, the secondary inflation pressure stemming from rising fertilizer and energy costs appears increasingly unavoidable.
Safe-haven assets: Irans shift from “proportional retaliation” to “continuous strikes” suggests rising unpredictability in the conflict, likely keeping the safe-haven premium for gold and the U.S. dollar elevated.
Policy risk: If the Federal Reserve signals next week that geopolitical risks may force interest rates to remain higher for longer, equity markets, particularly technology stocks, could face a new round of valuation adjustments.
[Chart 3: Gold H1 (Hourly) Technical Analysis]
MACD Analysis
Analysts View
A break below 5100 could lead prices to seek further support near 5050.
Conversely, a reclaim above 5200 may open the door for another attempt toward the 5230–5300 resistance zone.
Meanwhile, French President Emmanuel Macron acknowledged that coordinating maritime escort operations in the strait could take several weeks, contradicting Trumps assertion that the conflict could end quickly.
The United Kingdom confirmed that three vessels were attacked near the strait on Wednesday. Trump stated he does not believe Iran has deployed naval mines and claimed that U.S. forces had destroyed nearly all Iranian minelaying vessels. However, he warned that if Iran uses civilian ports for military activities, the U.S. military would respond with targeted strikes.
The U.S. military has also preliminarily concluded that an Iranian school was struck accidentally, an incident that Tehran is now leveraging to rally international opinion and strengthen its demands for compensation.
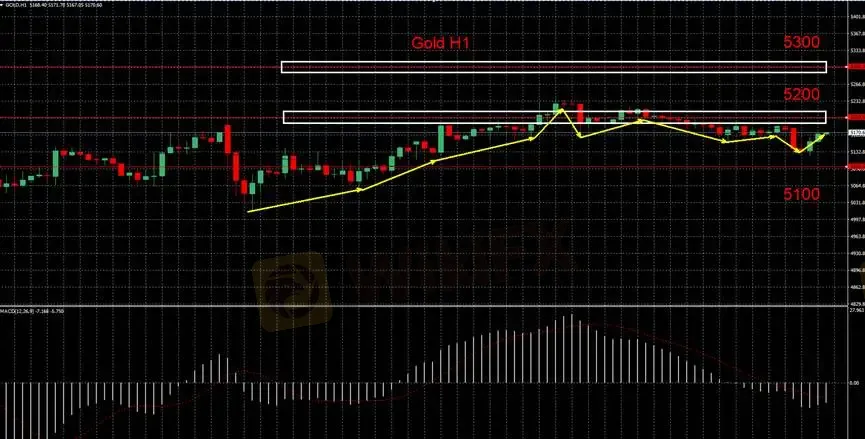
Golds H1 chart currently remains in a range-bound consolidation pattern, with prices fluctuating between 5100 and 5200.
After recently testing the 5200 resistance zone, prices pulled back, indicating persistent selling pressure at higher levels. Meanwhile, repeated rebounds near 5100 suggest strong underlying support, leaving the market in a high-level consolidation phase without a decisive short-term breakout.
MACD momentum has gradually weakened from the previous bullish phase. The histogram continues to shrink and is moving toward the zero line, while the fast and slow lines show signs of downward divergence. This indicates fading bullish momentum and a shift toward bearish short-term pressure, suggesting the market may continue consolidating with a corrective bias in the near term.
Traders should closely monitor the 5100 support and 5200 resistance levels:
⚠ Risk Disclaimer:
The views, analysis, research, price levels, and other information provided above are intended solely as general market commentary and do not represent the position of this platform. Readers should conduct their own due diligence and assume full responsibility for any trading decisions. Trading involves risk, and caution is advised.

WikiFX Broker
Latest News
Ipoh Businessman Loses RM1.25 Million in Crypto Group that Promised High Returns
 WikiFX
ActivTrades Review 2026: Regulation, Complaints, and Withdrawal Risks
WikiFXAligning H4, H1, and M15 Charts for Clearer Intraday Forex Trades
WikiFXBuilding a Forex Strategy: What Beginners Get Wrong About Risk and Chart Patterns
WikiFXRisk Management for Beginners: How Margin and Stop-Losses Prevent Account Blowouts
WikiFXWikiEXPO Hong Kong 2026 Set to Open, Bringing Together Global Leaders in Fintech and Digital Finance
WikiFXTopFX Review 2026: Profits Earned, Account Terminated, Withdrawal Denied? Check This Investigation
WikiFX⚽💱 World Cup · Forex Predict & Win Event
WikiFXBotBro Review 2026: Complaints, Withdrawals, and Risk Signals
WikiFXReading Market Bottoms: Why Support Zones Tell the Real Story
WikiFXRate Calc

