AMD–Meta Partnership Ignites Risk-On Rally
Abstract:The newly announced strategic partnership between AMD and Meta served as a fresh catalyst for risk assets, lifting U.S. equities across the board. All four major U.S. indices closed higher, while risi
The newly announced strategic partnership between AMD and Meta served as a fresh catalyst for risk assets, lifting U.S. equities across the board. All four major U.S. indices closed higher, while rising risk appetite further pressured gold prices.
Gold and silver diverged. Gold declined 0.94% to close at $5,5176.71 per ounce, while silver gained 0.70% to settle at $87.18 per ounce.
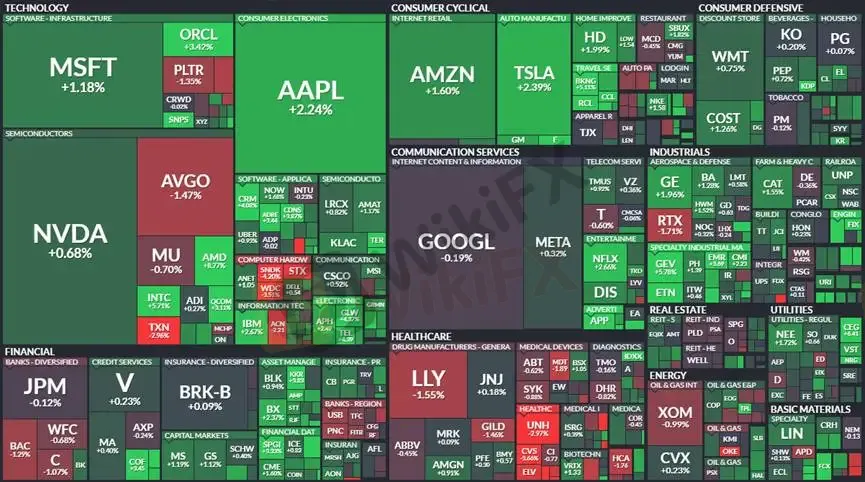
(Figure 1: S&P 500 Sector Heatmap – Technology Leads Gains | Source: FINVIZ)
Structure of the AMD–Meta Deal
AMD and Meta announced a five-year strategic partnership under which Meta will deploy 6GW of AMD GPU capacity. In exchange, AMD will grant up to 160 million performance-based warrants, representing approximately 10% ownership, vesting in tranches tied to deployment milestones and stock price thresholds.
In practical terms, Meta commits to purchasing substantial volumes of AMD chips, while AMD provides Meta the right to become a major shareholder.
This structure creates a natural hedge between procurement spending and equity upside. To illustrate: if Meta were to purchase $100 billion worth of hardware and AMDs stock were to rise to $600, the value of the 10% stake could reach approximately $96 billion. Under such a scenario, the equity appreciation would effectively offset much of the infrastructure cost.
The first tranche of warrants unlocks after delivery of the initial 1GW of GPU capacity, with subsequent tranches tied to cumulative deployment toward the 6GW target.
For existing AMD shareholders, issuing 10% equity represents meaningful dilution. However, if that dilution is accompanied by a tripling of share price and a $600+ billion increase in market capitalization, shareholder acceptance would likely be strong.
Goldman Sachs noted that AMD is effectively exchanging future equity dilution for “order certainty” and market share validation from Meta. Initial shipments are expected to begin in the second half of 2026. AMD previously entered into a similar agreement with OpenAI in late 2025.
Despite recent noise surrounding AI spending sustainability, the announcement reignited investor enthusiasm. AMD shares surged 8% at the close, while Meta rose a modest 0.32%.
The markets response suggests continued confidence in AI-driven productivity gains and infrastructure expansion.
AIs Macro Impact: Inflationary Hardware vs. Deflationary Labor Shock
From a macro perspective, AI carries a dual narrative:
1. Inflationary Forces (Infrastructure & Energy Demand)
Data center construction and AI compute clusters drive substantial energy and hardware demand, reinforcing capital expenditure cycles and creating inflationary pressure.
2. Deflationary Forces (Labor Displacement Risk)
At the same time, AI-driven labor substitution intensifies concerns over structural unemployment and slower long-term growth. This dynamic has prompted bond markets to price in prolonged economic softness and a potentially extended Federal Reserve easing cycle.
Divergence Between the Fed and the Market
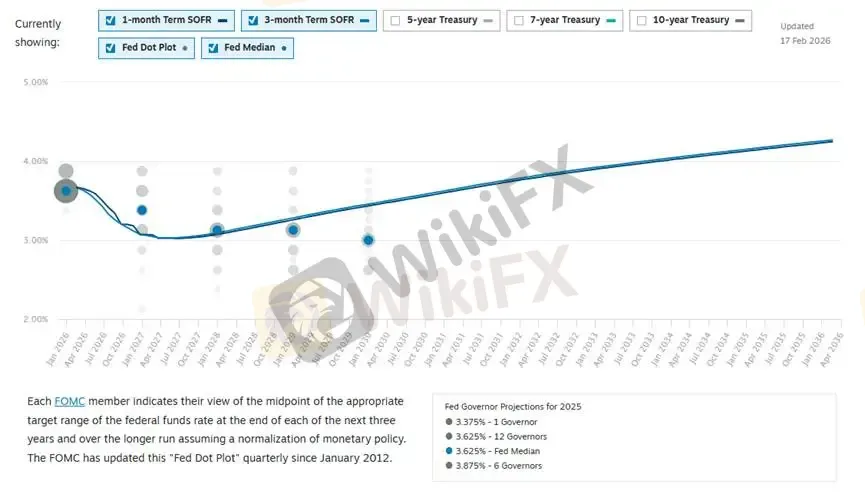
(Figure 2: SOFR Forward Rate Curve | Source: Chatham Financial)
The chart highlights a notable divergence between Federal Reserve projections and market pricing.
While Fed officials continue to signal relatively elevated rate expectations, the market-implied SOFR curve (blue line) has already shifted materially lower, implying additional rate cuts through 2026 and 2027.
The curve reaches a trough near 3.0% in 2027 before gradually rising, reflecting a flattening structure as short-term rates converge toward longer-term expectations.
Capital flows indicate increasing use of SOFR options as recession hedges, particularly amid concerns that AI-driven disruption could weigh on employment and growth. Markets appear to be pricing in a scenario where the Fed may ultimately be compelled to ease earlier than currently projected to preserve macro stability.
Gold Technical Analysis
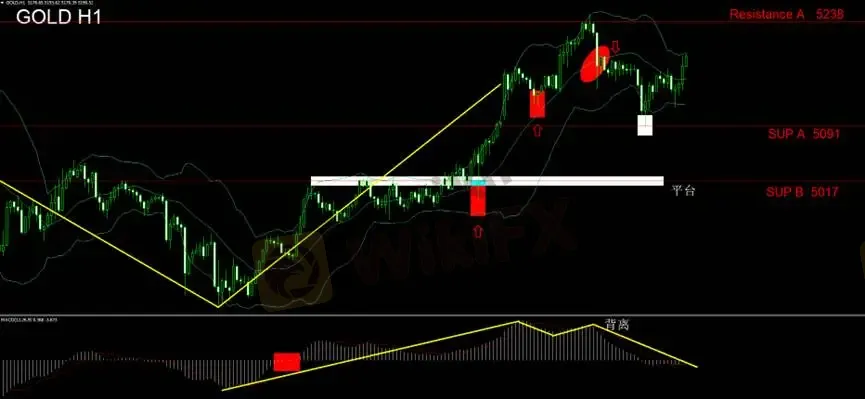
Continuing from yesterdays technical outlook, the Bollinger Bands remain widening downward, suggesting ongoing corrective pressure.
During the U.S. session, gold extended losses to test first support near 5091 before rebounding sharply. Price action broke above the Bollinger midline and reached the upper band during the Asian session. Traders should monitor for potential high-level consolidation.
Short positions initiated under the prior strategy should have been exited upon a confirmed break above the mid-band. The original plan to build short exposure along the midline is no longer aligned with current price structure.
The MACD oscillator shows post-divergence histogram contraction, with momentum hovering near the zero line, indicating a lack of decisive trend strength.
Risk Disclaimer
The views, analysis, research, price levels, and other information presented herein are provided solely for general market commentary and do not represent the official position of this platform. All readers assume full responsibility for their investment decisions. Please trade prudently.

WikiFX Broker
Latest News
LOYAL PRIMUS Review: FSCA-Regulated Broker Faces Mounting Withdrawal Complaints
 WikiFX
GFS Review 2026: Withdrawal Complaints, MT5 Access, and Regulation Gaps
WikiFXHow Trading Costs Quietly Drain Your Account: Spreads, Swaps, and Pip Values
WikiFXWhy MetaTrader 4 Remains the Top Choice for Testing Automated Trading Robots
WikiFXDollar Firms as Geopolitics Pressures Asian Currencies
WikiFXWhy Most Retail Traders Fail: What the Numbers Reveal
WikiFXThings About HTFX Broker That You Don't Know About
WikiFX22K Trader Review 2026: Ongoing User Allegations Raise Fresh Questions About Trust
WikiFXeFishery Founder Jailed Nine Years as KWAP Defends RM163 Million Loss
WikiFXKASPER CAPITAL MARKETS Review 2026: Regulation, Safety, and User Feedback
WikiFXRate Calc

