U.S. Dollar Breaks to New Lows
Abstract:We previously flagged the risk of a downside break in the U.S. dollar. While market consensus has largely attributed recent weakness to coordinated efforts by the U.S. and Japan to curb excessive yen
We previously flagged the risk of a downside break in the U.S. dollar. While market consensus has largely attributed recent weakness to coordinated efforts by the U.S. and Japan to curb excessive yen depreciation, last Fridays Japanese government bond market delivered a shock. Volatility surged by an extraordinary six standard deviations, underscoring that market pricing for both the yen and Japanese government bonds remains fundamentally distorted.
On the 27th, Donald Trump was asked by reporters whether he was concerned about the depreciation of the U.S. dollar. He responded that he does not view the dollars decline as excessive, but rather sees it as a sign of healthy market dynamics. He emphasized that the dollar should be allowed to find its fair value organically, while also criticizing Asian economies for attempting to weaken their currencies.
Following these remarks, the U.S. Dollar Index plunged to 95.89, while USD/JPY broke below the 155 level, falling to 152.89. Notably, the sharp appreciation of the yen and the rapid depreciation of the dollar did not trigger spillover stress across other financial assets. This contained reaction has been reassuring.
Previously, we were concerned that a stronger yen could drive capital back into Japan, forcing traders to cover yen short positions by unwinding risk assets such as U.S. equities, gold, and U.S. Treasuries. That scenario has not materialized. Instead, investors appear to be interpreting dollar weakness as a net positive, primarily through the lens of improved U.S. trade competitiveness.
According to Bank of Americas January 22 fund flow report, the firm draws a parallel between the 1970s and the 2020s. In the early 1970s, the “Nifty Fifty” peaked in 1972. From 1971 to 1974, gold delivered the strongest returns, while from 1975 to 1977, small-cap equities took over as market leaders.
Bank of Americas use of the 1970s as a reference point is not based solely on CPI comparisons, but rather on similarities in macroeconomic structure and policy regime shifts.
Key Macro and Policy Parallels Between the 1970s and the 2020s
1. Fiscal Expansion and Debt Monetization (Currency Debasement)
After the collapse of the Bretton Woods system in 1971 and the decoupling of the U.S. dollar from gold, the U.S. entered a fiat currency era marked by aggressive fiscal spending. Today, the Trump administrations preference for maintaining high nominal growth and low real interest rates closely resembles the monetary environment of the 1970s.
2. The “Great Bond Bear Market” and a Turning Point in the Rate Cycle
The 1970s marked the inflection point that ended a 30-year secular bull market in bonds. Bank of America argues that a similar long-term structural reversal in the interest rate cycle may now be underway.
3. From the “Invisible Hand” to the “Visible Fist”
The Trump administration has increasingly relied on administrative intervention to manage living costs. A government-led economic framework tends to compress profit margins for large corporations, while historically favoring the relative performance of small-cap equities.
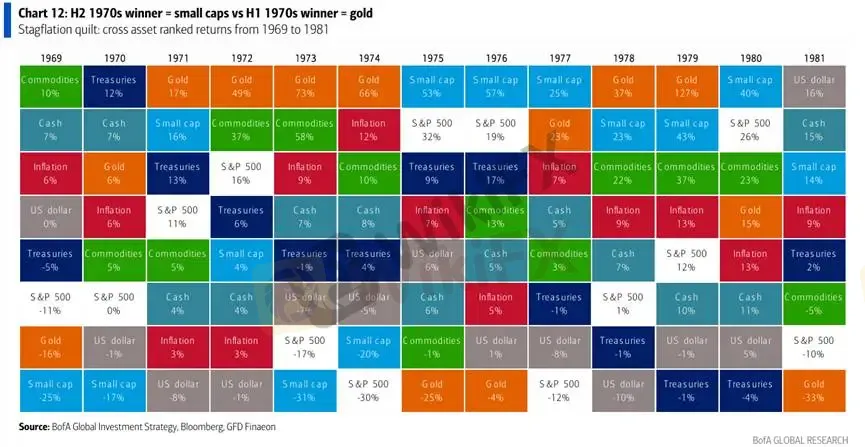
(Figure 1: Asset Return Rankings, 1969–1981; Source: Bank of America)
As the U.S. dollar weakens, Asian emerging markets stand to benefit, and the potential for capital to flow back into Asia is also embedded in Bank of America‘s outlook. The report’s constructive view on China is rooted in a broader reassessment of U.S. exceptionalism, citing the end of deflationary pressures, a rebound in consumption, and increasingly attractive valuations in the Chinese market.
However, from a business cycle perspective, we believe the current environment aligns more closely with a productivity-driven cycle that carries an inflationary undertone.
Bank of America identifies several long-term forces that are structurally pushing costs higher, including currency debasement, fiscal expansion, policy shifts, and rising commodity prices. While policymakers may attempt to suppress prices in the short term, the medium- to long-term risks of a renewed inflationary upswing remain firmly in place. Driven by currency depreciation, persistent fiscal deficits, and historical cyclical patterns, inflation is likely to re-emerge as a defining theme in the latter half of the 2020s.
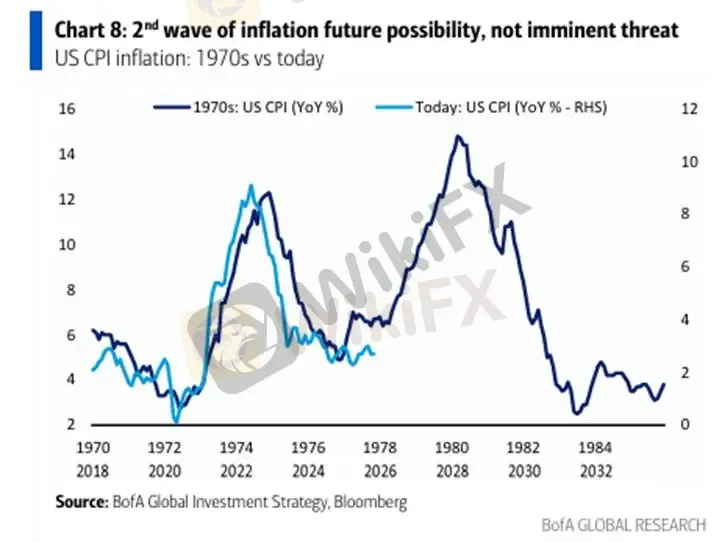
(Figure 2: Inflation Trends Comparison Between the 1970s and the Present; Source: Bank of America)
Risk Disclosure:
The views, analyses, research, prices, or other information presented above are for general market commentary only and do not represent the position of this platform. All readers assume full responsibility for their own investment decisions. Please trade with caution.

WikiFX Broker
Latest News
Malaysia’s Pension Fund (KWAP) Hit by eFishery Fraud Scandal with RM163 Million at Risk
 WikiFX
EMAR MARKETS Review 2026: FSCA Regulation, Withdrawal Complaints, and Account Access Risks
WikiFXFacing a 20% Floating Loss: How Beginners Can Prevent a Margin Call
WikiFXInstaForex Review 2026: Is This Forex Broker Safe?
WikiFXSandStoneFX Review 2026: Is This Forex Broker Safe?
WikiFXFake Investment Scam and Human Trafficking Network Busted with 109 Arrested
WikiFXForex Traders With Day Jobs: The PERKESO Deadline You Cannot Ignore
WikiFXMaxpro365 Review 2026: Where Is My $23,000? We Investigated User Allegations About Missing Funds
WikiFXHow Trading Costs Quietly Drain Your Account: Spreads, Swaps, and Pip Values
WikiFXWhy MetaTrader 4 Remains the Top Choice for Testing Automated Trading Robots
WikiFXRate Calc

