FPG BTCUSD Market Report January 6, 2026
Abstract:On the BTCUSD (Bitcoin) H1 chart, price is experiencing a strong bullish rally after previously consolidating in a sideways range. Bitcoin surged from the 87,094 demand area toward a recent peak near
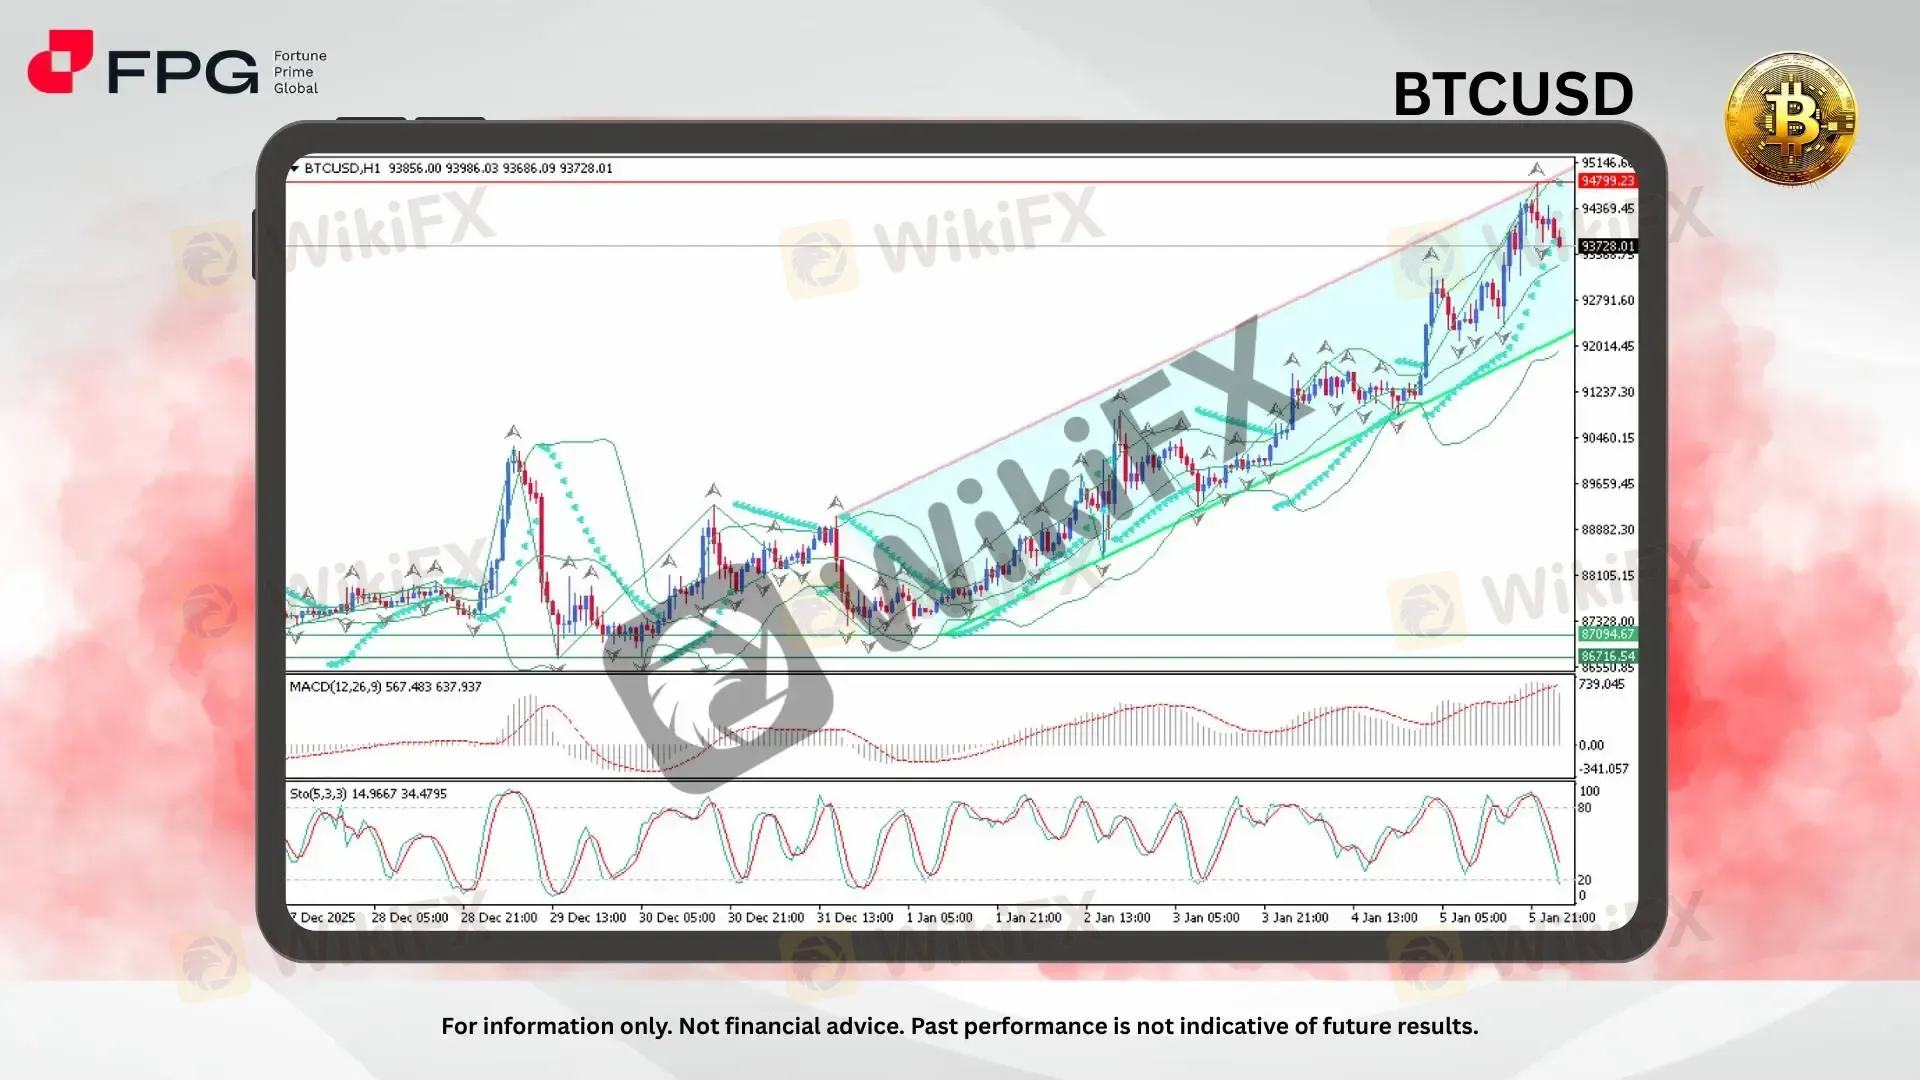
On the BTCUSD (Bitcoin) H1 chart, price is experiencing a strong bullish rally after previously consolidating in a sideways range. Bitcoin surged from the 87,094 demand area toward a recent peak near 94,799, forming a clear ascending bullish channel. Currently, BTC is trading around 93,728, remaining within the bullish structure, although short-term volatility has increased following rejection near the upper channel boundary.
From a technical perspective, BTCUSD continues to print higher highs and higher lows, confirming bullish market structure despite recent pullbacks. Price remains supported by the rising channel base and dynamic moving average support. MACD (12,26,9) is firmly above the zero line with an expanding histogram, signaling strong bullish momentum and trend continuation bias. Meanwhile, Stochastic Oscillator (5,3,3) has recently dipped from overbought territory toward the mid-lower range, suggesting short-term corrective pressure rather than a full trend reversal, potentially allowing momentum to reset for the next bullish leg.
Fundamentally, Bitcoin remains driven by a combination of long-term adoption growth and macroeconomic influences. Continued institutional and retail adoption supports structural demand, while Bitcoins fixed supply and halving mechanism reinforces its long-term bullish narrative. At the same time, broader macro factors, such as global interest rate expectations, inflation dynamics, and evolving regulatory stances toward digital assets, remain key volatility drivers. As long as risk sentiment stays constructive and no major negative regulatory catalysts emerge, BTC momentum is likely to remain biased to the upside despite near-term corrections.
Market Observation & Strategy Advice
1. Current Position: BTCUSD is trading around 93,728, still holding within the bullish channel structure.
2. Resistance Zone: Immediate resistance is located near 94,799–95,146, marking the upper supply zone and channel cap.
3. Support Zone: Initial support lies around 92,000–91,200, with stronger demand seen near 87,094.
4. Indicators: MACD remains bullish, while Stochastic is cooling from overbought levels, indicating a potential short-term pullback phase. The broader intraday trend remains bullish, with volatility favoring trend-following setups.
5. Trading Strategy Suggestions:
Buy on pullback: Look for bullish confirmation near 92,000–91,200 within the channel support area.
Breakout continuation: A clean break and hold above 94,800 could open an upside extension toward 95,100+.
Risk control: A sustained breakdown below 87,094 would invalidate the bullish structure and signal deeper correction risk.
Market Performance:
Crypto Last Price % Change
ETHUSD 3,212.7 −0.38%
SOLUSD 137.59 −0.22%
Today's Key Economic Calendar:
FR: Inflation Rate MoM & YoY Prel
US: Fed Barkin Speech
DE: Inflation Rate MoM & YoY Prel
Risk Disclaimer: This report is for informational purposes only and does not constitute financial advice. Investments involve risks, and past performance does not guarantee future results. Consult your financial advisor for personalized investment strategies.

WikiFX Broker
Latest News
How Trading Costs Quietly Drain Your Account: Spreads, Swaps, and Pip Values
 WikiFX
Why MetaTrader 4 Remains the Top Choice for Testing Automated Trading Robots
WikiFXeFishery Founder Jailed Nine Years as KWAP Defends RM163 Million Loss
WikiFXGFS Review 2026: Withdrawal Complaints, MT5 Access, and Regulation Gaps
WikiFXLOYAL PRIMUS Review: FSCA-Regulated Broker Faces Mounting Withdrawal Complaints
WikiFXDollar Firms as Geopolitics Pressures Asian Currencies
WikiFXKASPER CAPITAL MARKETS Review 2026: Regulation, Safety, and User Feedback
WikiFXThings About HTFX Broker That You Don't Know About
WikiFXWhy Most Retail Traders Fail: What the Numbers Reveal
WikiFX22K Trader Review 2026: Ongoing User Allegations Raise Fresh Questions About Trust
WikiFXRate Calc

