FPG BTCUSD Market Report November 21, 2025
Abstract:BTCUSD has undergone a prolonged bearish decline. The weakness began when the price stalled near the major resistance at 116,411, followed by a sharp rejection that triggered continuous selling pressu
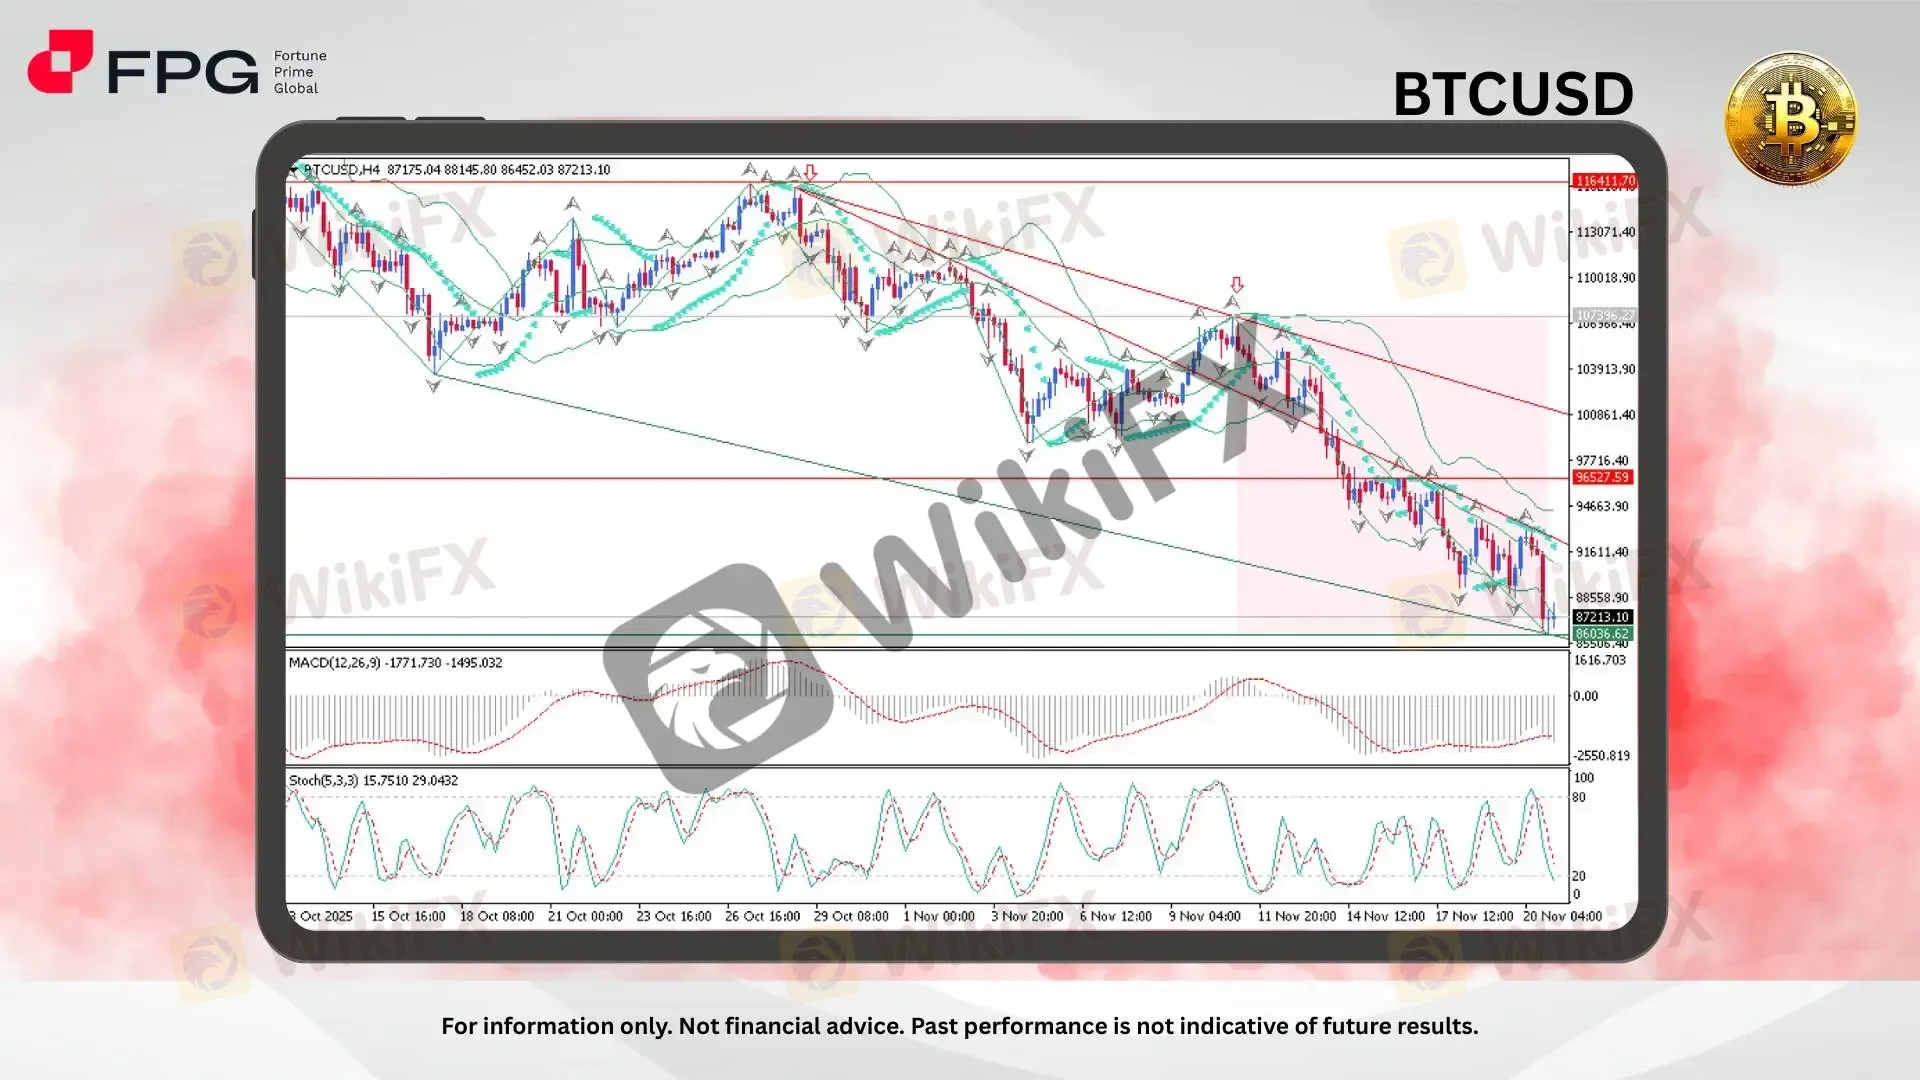
BTCUSD has undergone a prolonged bearish decline. The weakness began when the price stalled near the major resistance at 116,411, followed by a sharp rejection that triggered continuous selling pressure. Price subsequently broke below 107,396, a key support level which later flipped into resistance. Since then, bearish momentum has dominated, driving the price further down to around 87,213. This marks a substantial drop within roughly one month, highlighting a strong bearish sentiment and notable loss in market value.
From a technical perspective, price action is moving within a well-defined descending channel, creating lower highs and lower lows. The Bollinger Bands are slightly widening, indicating that volatility has increased as price approaches the lower band, suggesting downward pressure remains active. The MACD (12,26,9) is positioned deeply below the zero line at -1771.730 and -1495.032, clearly signaling strong bearish momentum with no visible sign of bullish crossover yet. Meanwhile, the Stochastic Oscillator (5,3,3) shows values around 15.75 / 29.04, indicating an oversold condition that may hint at temporary corrective rebounds but lacking strong confirmation. Overall, the indicators reinforce the prevailing bearish structure.
Observing broader market sentiment and circulating news online, several corporate-scale Bitcoin holders have reportedly released substantial amounts of their BTC holdings, reallocating funds into other investment assets. This behavior reflects a cautious approach, showing reduced institutional confidence in the short-term performance of Bitcoin. Such sentiment-driven selling has further pressured the market, reinforcing the existing bearish trend and sustaining downside expectations in the near term.
Market Observation & Strategy Advice
1. Current Position: BTCUSD trades around 87,213, staying near the lower boundary of the descending channel, suggesting continued selling pressure while approaching possible exhaustion areas.
2. Resistance Zone: The nearest resistance stands at 91,611 followed by 96,527. A recovery toward these levels may only occur if a corrective rebound emerges from oversold conditions.
3. Support Zone: Immediate support sits at 86,036 and a deeper key level at 82,900. A decisive move below these zones could invite further bearish extension.
4. Indicators: MACD remains strongly bearish, Bollinger Bands widening confirms heightened volatility, while the Stochastic Oscillator indicates oversold conditions but lacks reversal confirmation.
5. Trading Strategy Suggestions:
Bearish Continuation: Consider short positions on minor pullbacks toward resistance zones, targeting lower support levels (85,600 and 82,900).
Oversold Rebound Setup: Watch for potential bounce opportunities if price forms reversal patterns near 86,036.
Risk Management: A daily close back above 95,300 would invalidate the bearish structure and call for reassessment.
Market Performance:
Crypto Last Price % Change
ETHUSD 2,862.5 +1.11%
SOLUSD 134.50 +0.76%
Today's Key Economic Calendar:
US: Fed Goolsbee Speech
AU: S&P Global Manufacturing & Services PMI Flash
JP: Inflation Rate YoY
JP: Balance of Trade
UK: GfK Consumer Confidence
JP: S&P Global Manufacturing & Services PMI Flash
UK: Retail Sales MoM
EU: ECB President Lagarde Speech
DE: HCOB Manufacturing PMI Flash
UK: S&P Global Manufacturing & Services PMI Flash
US: Fed Williams & Barr Speech
CA: Retail Sales MoM Final & Prel
US: S&P Global Composite, Manufacturing & Services PMI Flash
Risk Disclaimer: This report is for informational purposes only and does not constitute financial advice. Investments involve risks, and past performance does not guarantee future results. Consult your financial advisor for personalized investment strategies.

WikiFX Broker
Latest News
SquaredFinancial Review 2026: Heavy Complaints, Withdrawal Delays, and Profit Deletions
 WikiFX
Ubuntu Invest Review 2026: Is This Forex Broker Safe?
WikiFXMaking Sense of Central Bank News: How Revaluation, Interest Rates, and Reserves Move Currencies
WikiFXFive Chinese Fined RM4,000 Each for Promoting Cryptocurrency Investment Scheme in Malaysia
WikiFXFBS Review 2026: Is This Forex Broker Safe?
WikiFXWhy Employment Data Releases Destroy Short-Term Forex Trades
WikiFXRoboForex Review 2026: Are Traders Losing Sleep Over Missing Funds? Details Inside!
WikiFXIndian Stocks Rally, but the Rupee Breaks a Six-Day Winning Streak—What's Behind the Sudden Reversal
WikiFXVonway Forex Review 2026: Withdrawal Complaints, Regulation Warnings, and Account Risks
WikiFXStructuring a Practical Forex Trading Plan and Stop-Loss Strategy
WikiFXRate Calc

