CTA Funds’ “Stop-Loss Line” Exposed: Gold at $3,950 Becomes the Battle Line Between Bulls and Bears
Abstract:On Monday (Oct 27), gold prices suffered a sharp selloff as easing U.S.-China trade tensions cooled safe-haven demand, briefly falling below the psychological $4,000 level to a low of $3,971.38.By ear
On Monday (Oct 27), gold prices suffered a sharp selloff as easing U.S.-China trade tensions cooled safe-haven demand, briefly falling below the psychological $4,000 level to a low of $3,971.38.
By early Asian trading on Tuesday (Oct 28), prices had rebounded slightly to around $4,002, signaling a fierce tug-of-war between bulls and bears at this key round-number threshold.
Based on current market dynamics and capital flow analysis, here are the critical technical levels for gold:
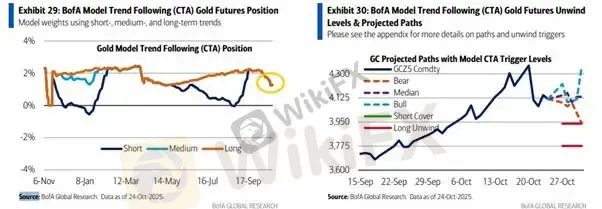
1. Key Lifeline (CTA Stop-Loss Level): $3,950
This is the most crucial support level for bullish positions — and a potential “flash crash” trigger point.
Background: According to a model by Bank of America (BofA), a large number of trend-following funds (CTAs) are currently “all-in long,” having built substantial long exposure during gold‘s uptrend in late September.
Trigger Mechanism: The $3,950 level represents these CTAs’ collective long-unwind trigger — essentially their stop-loss line.
Potential Risk: If gold drops further from the current ~$4,002 level and decisively breaks below $3,950, it could activate massive algorithmic sell orders. This automated chain reaction could flood the market with selling pressure, leading to a steep and rapid decline.
Mondays intraday low of $3,971.38 is already dangerously close to this zone, making $3,950 a line in the sand for bulls.
[Chart Title: Key Support Zone for Gold | Source: Bank of America]2. Short-Term Support / Psychological Barrier: $3,971 / $4,000
$4,000: A highly symbolic psychological threshold. Monday‘s brief breakdown and Tuesday’s recovery show how the market is battling around this pivot — the clearest barometer of short-term sentiment.
$3,971: Mondays intraday low (the lowest since Oct 10), forming the immediate support. A break below this level could swiftly send prices to test the $3,950 lifeline.
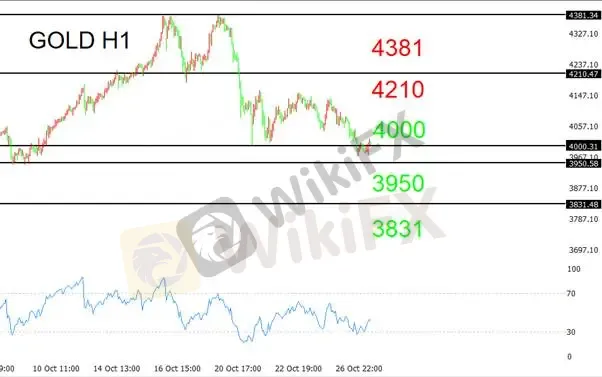
3. Major Resistance (Recent High): $4,381.29
$4,381.29: The record high set on Oct 20. With risk sentiment improving amid easing trade tensions, this level remains strong resistance. A fresh rally toward this price would likely require a new major catalyst — such as dovish Fed action or renewed geopolitical tensions.
Summary
Gold is currently caught between conflicting forces: bearish fundamentals (trade détente) and bullish technical positioning (CTA long exposure).
Downside Risk: $3,950 stands as the bulls last line of defense. A breakdown below could trigger a cascade of stop-loss selling.
Short-Term Trend: Watch the $4,000 zone closely. Holding above could give bulls breathing room.
Upside Potential: Until gold reclaims $4,381.29, upward momentum remains limited.
Trading Plans
Short Setup (Momentum/Breakout Strategy):
Stay patient and observe the $4,000 support area. If gold fails to hold this level, well follow the downward momentum, targeting $3,950 as the first take-profit zone.
Long Setup (Reversal/Value Entry):
Conversely, if the $4,000 support holds firmly, it may present a buying opportunity for early bulls, targeting $4,100 on the upside.
Resistance: $4,210 / $4,381 per ounce
Support: $3,720 / $3,950 / $4,000 per ounce
Risk Disclaimer:
The views, analyses, and price levels mentioned above are for general market commentary only and do not represent the position of this platform. Readers should conduct their own due diligence and trade at their own risk.

WikiFX Broker
Latest News
The Moving Average Trap: How to Read Price Action for Earlier Forex Entries
 WikiFX
Why Real Money Forex Trades Trigger Early Exits
WikiFXRM371,000 in Life Savings Lost After Trusting a Facebook Investment Ad
WikiFX$100 Million Fine, Deposit Delays and Customer Outrage: Is TIGER BROKERS Losing Traders' Trust?
WikiFXCrude Oil Sinks On Iran Deal
WikiFXFBS Review: Regulated Broker or High-Risk Forex Trap?
WikiFXAssexmarkets Review 2026: Severe Complaints, Unregulated Status, and Login Risks
WikiFXThe Access Bank UK Review 2026: FCA Regulation and Withdrawal Facts
WikiFXDollar Weakens and Oil Slumps on Deal
WikiFXWTI Crude Sinks as Strait of Hormuz Reopens
WikiFXRate Calc

