U.S. Equities Hit Fresh Highs! Should Investors Focus on Labor Market Trends?
Abstract:As the U.S. government faces a shutdown, labor market dynamics can only be gauged through weekly jobless claims, which remain one of the few available indicators guiding monetary policy expectations.
As the U.S. government faces a shutdown, labor market dynamics can only be gauged through weekly jobless claims, which remain one of the few available indicators guiding monetary policy expectations. Meanwhile, U.S. equities continue to rally aggressively, pushing the S&P 500 to trade at over 22x forward earnings — levels that appear stretched by historical standards. With valuations this elevated, how should investors approach the market? While we remain cautious about downside risks, tactical long opportunities may be viable through short-term adjustments rather than broad bullish positioning.
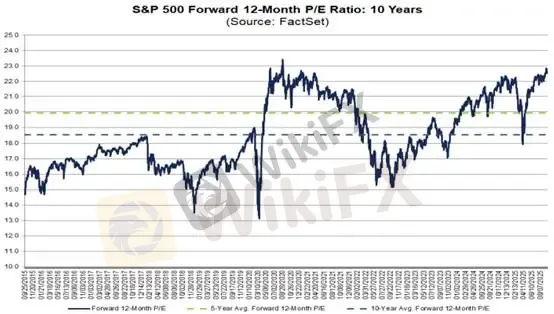
(Figure 1: Forward 12-Month P/E Ratio of the S&P 500; Source: Factset)
1. No Recession Pricing as the Fed Manages Inflation
The Federal Reserve cut rates by 25 bps in September and delivered a total of 75 bps of easing year-to-date. However, the September SEP and dot plot communicated a more restrictive outlook, showing the median 2025 Fed funds rate at 3.50–3.75%, implying one fewer cut than previously expected.
As a result, long-term Treasury yields did not fully follow the Feds dovish pivot. The 10-year Treasury yield remains above 4%, while the 3-month T-bill yields 3.96% and the 2-year yield stands at 3.54%.
This policy stance reflects the Feds dual objective: easing short-term rates to support growth while allowing long-term yields to remain elevated, maintaining inflation discipline. The result is a bull steepening of the yield curve.
(Figure 2: U.S. 10Y–2Y Yield Curve; Source: MacroMicro)2. Labor Market Cooling Confirmed — 300K Jobless Claims as the Red Line
With key data releases like Nonfarm Payrolls (NFP) and CPI suspended during the government shutdown, markets are relying heavily on jobless claims as a leading gauge.
Initial jobless claims apply to W-2 employees (salaried workers filing through corporate payroll tax). Freelancers, influencers, and athletes are excluded. Eligibility is based on involuntary unemployment, which qualifies for unemployment insurance.
Wall Street views 300K claims as the warning threshold. Historically, during strong economic expansions, claims hover between 200K–250K. A sustained move above 300K often signals a labor market slowdown and foreshadows an unemployment rate above 4.5%–5.0%.
For context, the U.S. long-term average unemployment rate is 5.5%–6.0%. Readings below 5% still suggest broadly healthy conditions. The natural rate of unemployment (NAIRU) is estimated at 4.0%–5.0%, meaning levels under 5% are not inherently concerning.
3. If Claims Hold Above 300K for Three Weeks, NFP Could Turn Negative
Historically, monthly job growth of 150K–200K represents healthy expansion, while figures below 100K indicate labor market weakness. Jobless claims trends provide a rough proxy:
4-week average ≈ 300K → NFP growth likely +30K–50K
4-week average ≈ 315K → NFP close to zero
4-week average ≥ 330K → NFP potentially negative (layoffs exceeding hiring)
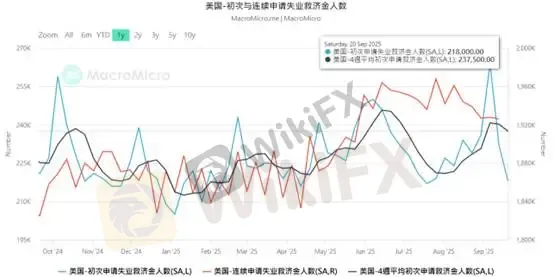
(Figure 3: Initial & Continuing Jobless Claims; Source: MacroMicro)
Currently, the data is not overly alarming. Initial claims recently dropped to 218K, while continuing claims also declined, pulling the 4-week moving average down to 237K. This suggests some softening but not enough to indicate imminent labor market deterioration.
Thus, despite rich valuations, liquidity-driven flows continue to support equities. With rate-cut expectations moderating, markets are buying into the narrative of productivity-driven expansion, which has also weighed on gold prices.
Gold Technical Analysis
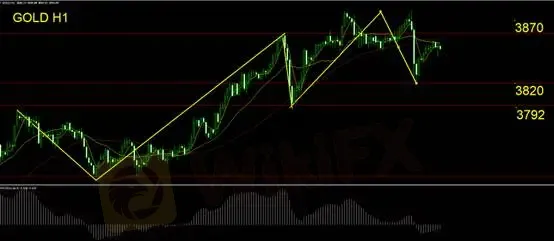
Momentum indicators such as MACD are showing a bearish divergence. On the hourly chart, gold has formed a double-top pattern, currently retesting the neckline as resistance.
Failure to break higher would shift focus to support at $3,820.
A third retracement is unfolding, with an estimated pullback size of $75.
If gold breaks below $3,820, the short-term uptrend would be invalidated, favoring short positions over dip-buying.
A breakout above $3,870 suggests staying sidelined.
Trading levels:
Support: $3,820 / $3,792
Resistance: $3,870
Suggested stop-loss: above $3,870
Risk Disclaimer: The views, analysis, research, prices, or other information herein are provided as general market commentary and do not constitute investment advice. Readers should assess risks independently and trade cautiously.

WikiFX Broker
Latest News
Dollar Steadies Amid Oil Swings
 WikiFX
Fast Profits vs Holding Overnight: Finding Your Forex Trading Pace
WikiFXDollar Eases As Gulf Tensions Cool
WikiFXTRANS X MARKETS Review: Unregulated Broker Warning for Forex Traders
WikiFXTrades Universal Review 2026: Unregulated Status and Regulator Warnings
WikiFXFAST TRADEFX Review 2026: Official Warnings and Severe Risk Signals
WikiFXRupee Sinks to Record Low as Dollar Steadies
WikiFXKevin Warsh to be sworn in as Federal Reserve chair on Friday
WikiFXTradeEU Review: Regulated Broker, Severe Withdrawal Complaints Exposed
WikiFXWhere Does Your Forex Trade Go? The Reality of OTC Markets
WikiFXRate Calc

