U.S. End Demand Fails to Absorb Price Increases, Corporate Profit Margins Likely Past Their Peak
Abstract:The U.S. Producer Price Index (PPI) for August showed a monthly decline of -0.1%, while core PPI rose 0.3%. Breaking it down, the services PPI fell -0.2%, whereas the goods PPI edged up 0.1%. This ind
The U.S. Producer Price Index (PPI) for August showed a monthly decline of -0.1%, while core PPI rose 0.3%. Breaking it down, the services PPI fell -0.2%, whereas the goods PPI edged up 0.1%. This indicates that U.S. companies continue to lose pricing power in the services sector, while higher input costs on the goods side remain a persistent pressure point.
Looking closer, the “trade index” plunged -1.7% (Chart 3)—a key gauge of profit margin changes reported by wholesalers and retailers.
Taken together, the August PPI data suggest a backdrop of weakening demand coupled with sticky input costs. With rising costs on one end and reduced pricing power on the other, U.S. corporate margins are clearly under pressure.
From the perspective of wholesalers and retailers—industries highly dependent on consumer spending and imports—the dilemma is clear: maintaining competitiveness to retain customers while being unable to fully pass on higher costs. With overall sales volumes already soft, the result is a double squeeze on both revenue and margins. From a fundamental standpoint, this raises the question of whether U.S. equity markets can sustainably hold at current levels.
Container Imports and Trade Outlook
According to supply chain tech firm Descartes, U.S. containerized imports in August rose 1.6% year-over-year, despite falling volumes from major supplier nations. However, trade uncertainty linked to Trumps tariff policies clouds the year-end outlook. U.S. ports handled 2.5 million TEUs (20-foot containers) in August, down from nearly 2.6 million TEUs in July, which was close to a record high.
Year-to-date imports are up 3.3% compared to the same period last year. The Port of Los Angeles suggested that July may have marked the peak for container imports. Industry officials warn that ongoing trade disruptions, a shrinking domestic manufacturing base, and concerns that inflation-strapped consumers may cut spending during the holiday season could weigh heavily on trade for the remainder of 2025.
As highlighted yesterday, a “cash is king” environment could re-emerge. While markets are pricing in rate cuts, the Federal Reserve has not yet reached the point of halting quantitative tightening (QT). For now, patience is warranted—wait for the crows to call.
Gold Technical Analysis
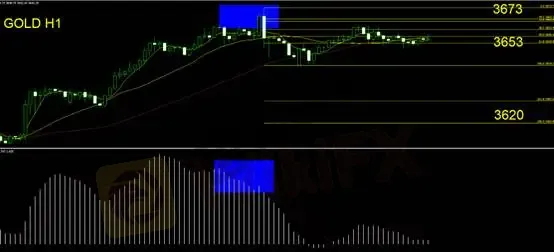
Technical indicators show MACD signaling a second bearish divergence, pointing to a corrective pullback in gold. Short positions initiated yesterday can continue to be held while awaiting exit signals.
The daily candlestick chart shows a bullish engulfing pattern, often a sign of a reversal to the upside. Current price action remains supported along the 5-day moving average, but caution is advised: chasing highs here carries notable risk.
For traders without open positions, staying sidelined may be the prudent choice. Those already short should stick to their exit discipline.
Support: 3620
Resistance: 3652 / 3673
⚠️ Risk Disclaimer: The views, analyses, research, prices, or other information provided herein are for general market commentary only and do not represent the official stance of this platform. All viewers are responsible for their own trading risks. Please exercise caution.

WikiFX Broker
Latest News
OROKU EDGE Review 2026: Blacklist Warnings, Withdrawal Complaints, and High Leverage
 WikiFX
Reading the Market Weather: How to Identify Forex Trends and Ranges
WikiFXUsing Volatility and ATR to Fix Your Forex Stop Loss
WikiFXIs It Your Fault for Falling for an Investment Scam?
WikiFXPIPS STAR Review 2026: Unregulated Status and What Indian Traders Should Check
WikiFXHousewife Loses RM250,000 Life Savings to Ghost Investment Scheme Promising 10% Returns
WikiFXDeltaFX Review 2026: My MT5 Account Was Locked During Trade. Did the Trader Lose Everything?
WikiFXCan AI Really Improve Forex Trading? The Benefits, Risks and Hidden Limitations
WikiFXVITTAVERSE Review 2026: Offshore Regulation and Withdrawal Complaints
WikiFXSaxo Bank Review 2026: Regulation, Clone Risks, and Trading Costs
WikiFXRate Calc

