Forex Candles - What Value Do They Add to Your Trading Experience?

Abstract:Wondering where you can see the forex price movement information? Easy, it’s all there on forex candles, which demonstrate different market sentiments to help traders make informed decisions. Keep reading to learn more.
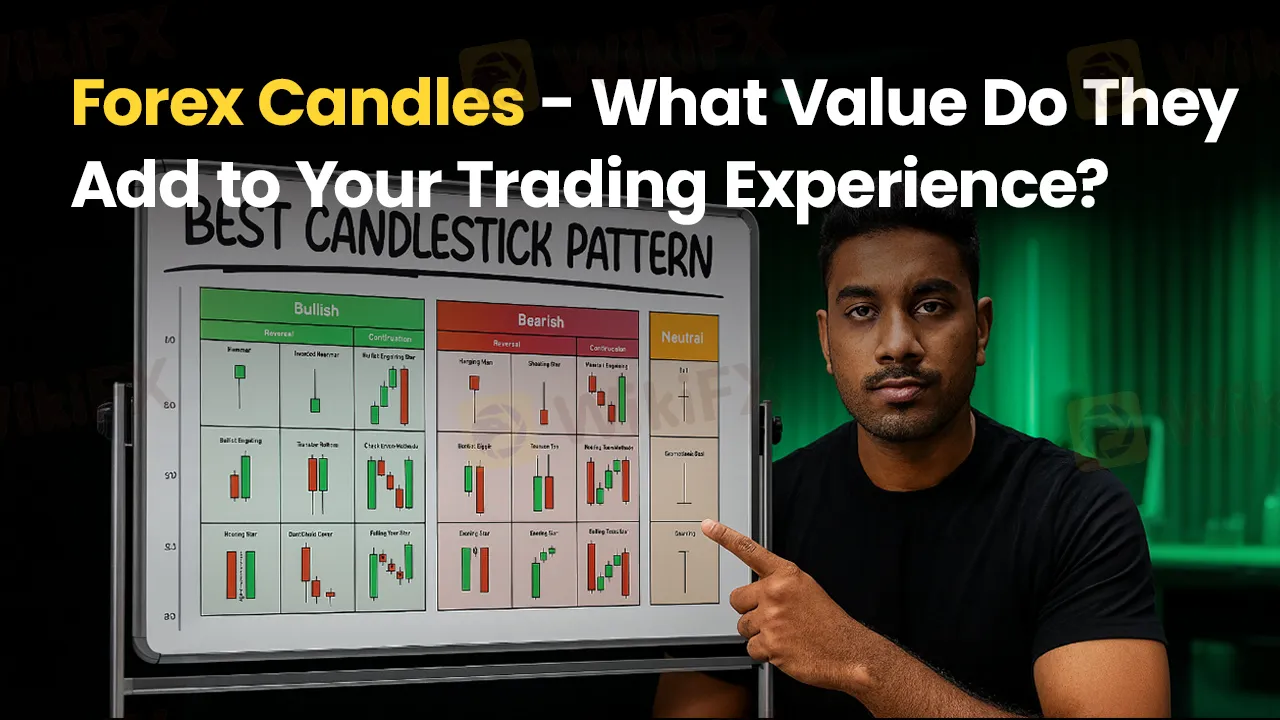
Wondering where you can see the forex price movement information? Easy, its all there on forex candles, which can even be called a candlestick. It forms a critical component of technical analysis that traders use to access price information quickly from a few price bars. Forex candles on a daily chart come with three basic features:
Body - Representing the Open-to-Close Range
Shadow - Indicating the Lows and Highs of Intra-day Trading
Color - A green color shows upward movement, while a red color denotes downward price movement.
Forex Candle Patterns Become Elaborate with Time
As time goes on, different forex candle patterns will be displayed, allowing traders to know several support and resistance levels. Many candlestick patterns hint at an opportunity that traders can maximize. Some patterns share details regarding the balance between selling and buying pressures, while others detect market indecision or continuation patterns. Forex candle patterns can express bullish or bearish market sentiments.
Bullish Forex Candles
After a market downtrend, bullish patterns may form and indicate price movement reversals. They indicate to traders the potential to earn profit from an upward trajectory by opening a long position. Here are some bullish forex candles to look at.
Hammer
The hammer candlestick pattern demonstrates a short body with a long lower shadow. You can find this at the lowest point of a downward trend. The lower shadow must account for at least twice the body length. A hammer demonstrates that despite selling pressures during the day. Ultimately, the buying pressure lifted the price. While the body color can change, green hammers point out a stronger bullish signal compared to red hammers. The next day needs to be bullish to be assured of the reversal pattern.
Inverted Hammer
It is a less bullish pattern with just one difference. The upper shadow remains long and forms around twice the body length, along with a short lower shadow. Forex candles demonstrating inverted hammer are a sign of buying pressure followed by a not-so-intense selling pressure to lower market prices. While the inverted hammer may show buyers with increased market control soon, its not a reliable metric to make decisions.
Bullish Engulfing
Two candlesticks - showcasing how a short red body is engulfed by a larger green candle - are used in the bullish engulfing pattern. Even though the second day starts on a lower note than the first, the bullish market raises the price and helps buyers maximize.
Piercing Line
It‘s a two-candlestick pattern built from a long red and green candle. Usually, you can witness a considerable gap between the closing price of the red candlestick and the opening price of the green candlestick. This indicates a strong buying pressure as the price goes up to or beyond the previous day’s mid-price.
Morning Star
This forex candle pattern showcases hope in a bleak market. It features three candle patterns with a short-bodied candle placed between two long red and green candles. Conventionally speaking, the ‘star’ will not undergo overlapping with longer bodies. The reason is that the market gaps, both on open and close. It hints at the subsiding of the selling pressure, and a bullish reversal is on the cards.
Three White Soldiers
This forex candle pattern is visible for over three days. The pattern demonstrates consecutive long green or white candles with small shadows. These demonstrate progressively higher opening and closing of forex compared to the day before. Its a very strong bullish signal appearing after a downtrend.
Bearish Forex Candles
Following an uptrend, bearish candlestick patterns usually appear. This signals the resistance level. The pessimism that ensued about the market price often makes traders close their long positions. They thus open a short position to benefit from the falling price.
Hanging Man
It remains the bearish equivalent of a hammer with the same shape but appears at the close of an uptrend. Just as the hammer, the lower shadow should be a minimum of twice the body length. This forex candle pattern hints at a tremendous sell-off during the trading day.
Shooting Star
Featuring the same shape as the inverted hammer, the Shooting Star appears in an uptrend. It features a small lower body and a long upper shadow of at least twice the body length. Generally, the market will gap a bit higher on opening and witness an intra-day high before settling at a price just above the opening price. This gives a feel of a falling star.
Bearish Engulfing
You will find this pattern at the bottom of an uptrend. Its first candle features a small green body engulfed by a long red candle. It demonstrates an impending market downturn.
Evening Star
A three-candlestick pattern, the ‘evening star’ is made from a short candle sandwiched between two long red and green candles, indicating the upward trend reversal.
Continuation Candlestick Patterns
These patterns do not point out market direction changes. They are continuation patterns that help traders spot a rest period in the market amid neutral price movement.
Doji
When the market opens and closes at virtually the same price point, the candlestick remains a plus or cross sign. This hints at a struggle between sellers and buyers, with neither of them receiving gains.
Spinning Top
With a short body centred between equally long shadows, the spinning top forex candle pattern showcases indecision prevailing in the market, leading to no meaningful price changes.
Falling Three Methods
It is a continual bearish market trend demonstrated by a long red body, then three small green bodies, and finally another red body. The green candles are all within the bearish body range. It indicates to traders that bulls have run out of steam to reverse the trend.
Rising Three Methods
The rising three-method candlestick pattern contains three short red candles sandwiched within two long green candles. This demonstrates that buyers are retaining market control even with some selling pressure.
Conclusion
We hope it has been an interesting read on forex candles and the immense value they add to traders. Keep watching the pattern carefully and place your bets correctly to keep winning the forex trading challenge.
For more captivating information on forex, download the WikiFX App.

You can also join the WikiFX India community on Telegram.

Read more

5 Clear Reasons Why Ultima Markets Is Smart Investment?
The Right Investment is hard to find these days. The Forex market is full of scam brokers, and it's a tough task to find the trusted ones. However, you can check out this article to discover 5 specific reasons why Ultima Markets stands out as a reliable choice.

JAFX - Where Investors Face Withdrawal Issues & Unprofessional Behavior
Are you facing withdrawal issues with JAFX? Are its executives asking you to pay a fee to get withdrawals? Accepted withdrawals failing to hit your wallet? You are virtually scammed by the company. Explore this story containing a wide range of issues investors face at JAFX.

Different Forex Market Regulators But One Common Goal - Investor Safety
Thanks to the tight regulatory framework adopted by forex regulators across the globe, investors are thriving all over. The monetary growth is also attributable to fair trade practices followed by brokers, courtesy of the regulations imposed by the market regulators. Forex by country, whether it’s the developed economy or an emerging one, is flourishing with increased trade, renewed customer confidence, and a massive profit potential that the market holds.

Do You Really Understand Your Trading Costs?
Trading in the foreign exchange market is often viewed as a game of precision, strategy and speed. But what many traders overlook is one of the most decisive factors affecting performance: cost. Not just the fees you can see, but the less visible costs hidden in the structure of every trade.
WikiFX Broker
Latest News
Alchemy Markets: A Closer Look at Its Licenses
WikiFXWondering Why Your International Earnings Come Less Than Expected? It's Because of Forex Markup Fees
WikiFXFCA to modernise rules to unlock investment
WikiFXHow Fake News Sites Are Fueling a Global Investment Scam Epidemic
WikiFXFrom Novice to Pro: Why Investors Trust Land Prime?
WikiFX10-year Treasury yield ticks lower after core CPI comes in slightly lightly lower than expected
WikiFXAsia-Pacific markets mixed after Trump's tariffs on Indonesia
WikiFXLabubu craze to drive up profit 350%, China\s Pop Mart says
WikiFXPrimeXBT Launches MT5 PRO Account for Active Traders
WikiFXCentral banks are increasingly buying gold from local mines as prices surge
WikiFXRate Calc
