Unveiling Bullish Reversal Candles

Abstract:The Key to Unlocking the Door to Bullish Reversal Wealth.
Bullish reversal candles
A bullish reversal candlestick pattern signals a potential change from a downtrend to an uptrend. It's a hint that the market's sentiment might be shifting from selling to buying
Bearish Patterns
A bearish reversal candlestick pattern is a sequence of price actions or a pattern, that signals a potential change from uptrend to downtrend. It's a hint that the market sentiment may be shifting from buying to selling.
Bearish reversal patterns can form with one or more candlesticks; most require bearish confirmation. The reversal indicates that selling pressure overwhelmed buying pressure for one or more days, but it remains unclear whether or not sustained selling or lack of buyers will continue to push prices lower.
Without confirmation, many of these patterns would be considered neutral and merely indicate a potential resistance level at best. Bearish confirmation means further downside follow through, such as a gap down, long black candlestick, or high volume decline. Because candlestick patterns are short-term and usually effective for 1-2 weeks, bearish confirmation should come within 1-3 days.
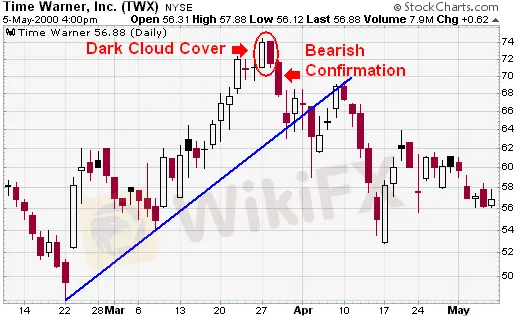
Time Warner (TWX) advanced from the upper fifties to the low seventies in less than two months (see chart below). The long white candlestick that took the stock above $70 in late March was followed by a long-legged doji in the harami position. A second long-legged doji immediately followed and indicated that the uptrend was beginning to tire. The dark cloud cover (red oval) increased these suspicions and bearish confirmation was provided by the long black candlestick (red arrow).
Hammer Candlestick
Hammer candlesticks form when a security moves significantly lower after the open but rallies to close well above the intraday low. The resulting candlestick looks like a square lollipop with a long stick. If this candlestick forms during a decline, it is called a Hammer.

Hammer and Inverted Hammer
In a hammer candle, the opening, closing and high prices are located near each other creating a body at the top, while a long wick extends lower. The wick is usually twice as big as the body.

Irrespective of the colour of the body, both examples on the image above are hammers. The green candle is usually considered a stronger signal as the close occurs at the top of the candle, signalling strong momentum.
An inverted hammer is exactly what the name itself suggests – a hammer turned upside down. A long upper shadow (wick), accompanied by the closing, opening and low prices are all registered near the same level at the bottom. Again, the upper wick should be twice as big as the body.

Like with a hammer, the green version of the inverted hammer is more bullish because of its higher close.
Bear Flag Pattern
The bear flag pattern is a continuation pattern that indicates a brief consolidation before the price resumes its downward trend. Recognizing this pattern helps traders identify when to enter short positions.
Bearish Engulfing Candle
A bearish engulfing candle is a powerful signal that indicates a potential trend reversal. It occurs when a larger bearish candle engulfs a smaller bullish candle, suggesting that sellers have overtaken buyers and could lead to further price declines.
Engulfing Candlestick
The engulfing candlestick pattern, whether bullish or bearish, highlights a shift in market dynamics. A bullish engulfing pattern suggests potential upward movement, while a bearish engulfing pattern signals a possible downward trend.
Bullish Divergence
Bullish divergence occurs when the price makes a new low while an indicator (like RSI) forms a higher low. This discrepancy suggests that selling pressure may be weakening, indicating a potential reversal in price direction.
WikiFX Broker
Latest News
Top Wall Street analysts are upbeat about these dividend-paying stocks
WikiFXSingapore's economy grows 4.3% in second quarter, beating expectations
WikiFXWhat WikiFX Found When It Looked Into Emar Markets
WikiFXMT4 vs MT5 Which Forex Trading Platform Fits Your Needs in 2025?
WikiFXStock futures slide on more Trump tariff letters, but are off worst levels of session: Live updates
WikiFXShort or Long Term: Which to Choose for Double-Digit Returns from Gold Investments?
WikiFXGold Soars Above $3,350 as XAU/USD Rallies on Trade Tensions
WikiFXAsia-Pacific markets trade mixed as investors assess Trump's latest tariff threats; bitcoin hits new highs
WikiFXWhat is Forex Trading Simulator?
WikiFXSwitzerland tourism boosted as women's soccer continues record-breaking rise
WikiFXRate Calc
