Understanding Bullish Candles: Key Indicators of Market Strength

Abstract:The Candlesticks Chart is considered to be the most popular chart type, also the oldest one, developed in the 18(th) century.
Candlestick Chart Patterns
The Candlesticks Chart is considered to be the most popular chart type, also the oldest one, developed in the 18(th) century.
Like the Bar Cart, it represents all four prices of security-open, high, low, and closing (OHLC), but with open and close represented in the thick body and high and low in the “candlewick”.
Candlestick patterns are used to predict the future direction of price movement. It tends mostly to represent trading patterns over short periods of time, often a few days or a few trading sessions. By default, it is set to daily in the Trade chart.
A candlestick is a type of price chart used in technical analysis that displays the high, low, open, and closing prices of a security for a specific period.
It originated from Japanese rice merchants and traders to track market prices and daily momentum hundreds of years before becoming popularized in the United States.
The wide part of the candlestick is called the “real body” and tells investors whether the closing price was higher or lower than the opening price.
Candlestick Patterns Book
The candlestick's body (the area between the open and the close) displays the opening and closing prices and how they compare to high and low.
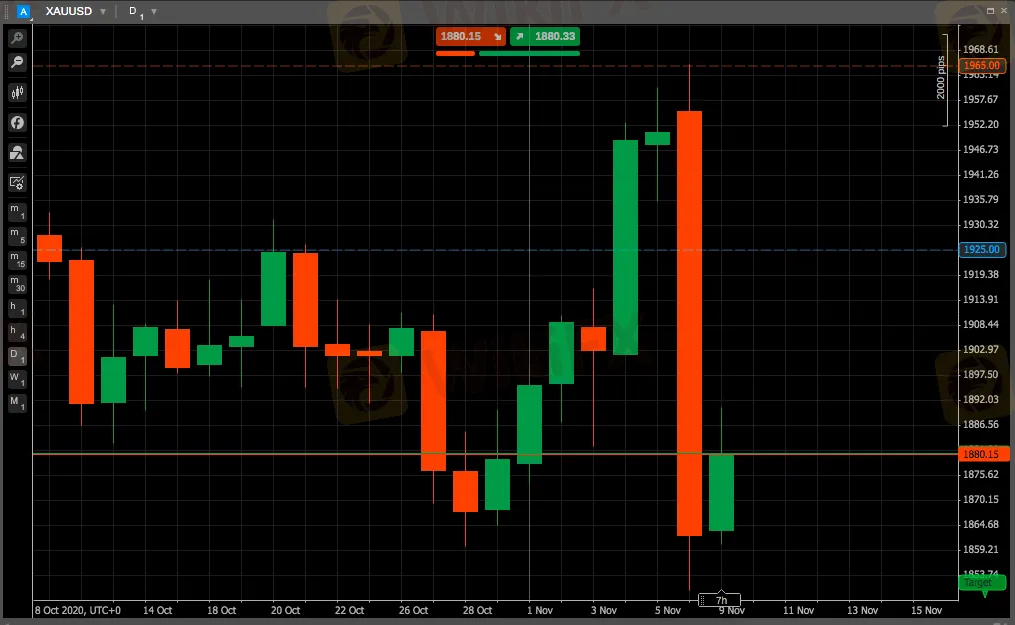
The Increasing (Bullish) candles in cTrader are displayed in green, while the Decreasing (Bearish) - in red. A candlestick's shape varies based on the relationship between the day's high, low, opening, and closing prices.
.

Bullish Reversal Candlestick Patterns
A bullish reversal candlestick pattern signals a potential change from a downtrend to an uptrend. It's a hint that the market's sentiment might be shifting from selling to buying.
How Do You Confirm a Bullish Reversal?
Patterns can form with one or more candlesticks; most require bullish confirmation. The actual reversal indicates that buyers overcame prior selling pressure, but it remains unclear whether new buyers will bid prices higher. Without confirmation, these patterns would be considered neutral and merely indicate a potential support level at best. Bullish confirmation means further upside follow through and can come as a gap up, long white candlestick or high volume advance. Because candlestick patterns are short-term and usually effective for only 1 or 2 weeks, bullish confirmation should come within 1 to 3 days after the pattern.
Advanced Candlestick Analysis
Advanced candlestick analysis involves not just recognizing individual patterns, but also understanding their context within the market. Traders can enhance their strategies by incorporating other technical indicators, such as moving averages or volume analysis, to confirm signals given by candlestick patterns. This comprehensive approach increases the probability of successful trades.
Single Candlestick Patterns
Single candlestick patterns are crucial for quick analysis. Notable examples include the doji candle, which signifies indecision in the market. A doji occurs when the opening and closing prices are nearly equal, indicating a potential reversal. Understanding these patterns allows traders to react swiftly to changing market dynamics.
Most Reliable Candlestick Patterns
Some of the most reliable candlestick patterns include the bullish engulfing, hammer, and morning star. These patterns tend to have strong predictive power regarding future price movements. For instance, a bullish engulfing pattern occurs when a smaller bearish candle is followed by a larger bullish candle, indicating a shift in momentum and potential trend reversal.
Japanese Candlestick White and Yellow Colors
In Japanese candlestick charts, colors play a significant role in conveying market sentiment. Typically, white (or green) candles represent bullish movements, indicating that the closing price is higher than the opening price. In contrast, yellow (or red) candles indicate bearish movements, where the closing price is lower than the opening price. Understanding these color cues helps traders quickly gauge market conditions.
Candlesticks

Candlesticks represent price movements within a specific timeframe, displaying open, high, low, and close values. Each candlestick provides a visual summary of market sentiment, with the body indicating the price range between the opening and closing prices. The wicks, or shadows, reflect the highest and lowest prices during that period, providing additional context.
WikiFX Broker
Latest News
Top Wall Street analysts are upbeat about these dividend-paying stocks
WikiFXSingapore's economy grows 4.3% in second quarter, beating expectations
WikiFXIn middle of Trump's trade war, importers hold more cash and move inventory off the books
WikiFXAsia-Pacific markets trade mixed as investors assess Trump's latest tariff threats; bitcoin hits new highs
WikiFXGold Soars Above $3,350 as XAU/USD Rallies on Trade Tensions
WikiFXWhat WikiFX Found When It Looked Into Emar Markets
WikiFXShort or Long Term: Which to Choose for Double-Digit Returns from Gold Investments?
WikiFXWhat is Forex Trading Simulator?
WikiFXMT4 vs MT5 Which Forex Trading Platform Fits Your Needs in 2025?
WikiFXStock futures slide on more Trump tariff letters, but are off worst levels of session: Live updates
WikiFXRate Calc
