Easing Inflation Keeps Fed on Hold—All Eyes Now on Labor Data
Abstract:U.S. consumer price index (CPI) data continues to suggest waning inflationary pressure. Headline CPI in April rose 2.3% year-over-year on an unadjusted basis, slightly below expectations and down 0.1
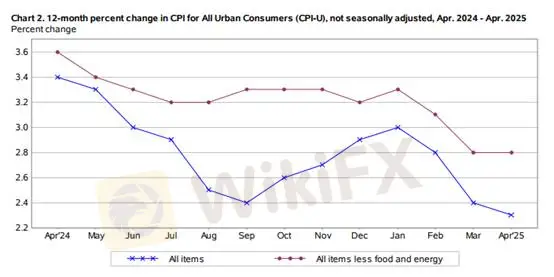
U.S. consumer price index (CPI) data continues to suggest waning inflationary pressure. Headline CPI in April rose 2.3% year-over-year on an unadjusted basis, slightly below expectations and down 0.1 percentage point from March. Month-over-month, CPI increased by 0.2%, reversing a prior -0.1% contraction. Core CPI, which strips out volatile food and energy prices, remained steady at 2.8% year-over-year and rose 0.2% on the month.

Figure 1: U.S. YoY CPI – Source: BLS
Energy prices declined for a second straight month, with a -0.2% monthly drop. Gains in natural gas and electricity failed to offset lower gasoline prices, which fell sharply, pushing the annual energy index down to -3.7%.
Food prices edged up 0.2%, but that marked a slowdown from the previous month. Notably, at-home food prices declined by 0.4%—a 0.9 percentage point drop from March and the largest monthly decline since September 2020. Egg prices plunged 12.7% month-over-month, helping to ease overall food inflation.
Core inflation saw a modest uptick, with shelter remaining the primary driver. Housing costs rose 0.3% month-over-month, accounting for more than half of the total CPI gain. Owners equivalent rent (OER) and rent indexes climbed 0.4% and 0.3%, respectively. Other contributors to the increase included household furnishings, healthcare, auto insurance, and education services.

Figure 2: U.S. MoM CPI – Source: BLS
The April CPI report points to an ongoing disinflation trend, with headline inflation now at its lowest level since early 2021. However, shelter costs continue to exert upward pressure on prices, and volatile energy costs present lingering uncertainty. The unexpected drop in food prices offered some relief to consumers. Despite a slight rebound in monthly core inflation, the broader trend remains tame, easing concerns about an imminent deflation scenario.
While current CPI figures show little evidence that tariff-related inflation has filtered into consumer prices, uncertainty over former President Trumps tariff policy combined with weakening inflation has put the Federal Reserve in a policy bind. Balancing between slowing growth and inflation control remains a core challenge. Many economists expect the inflationary effects of tariffs to begin surfacing in May.
If the Fed moves to cut rates in the face of both tariffs and soft inflation, it could risk reigniting inflationary pressures. As such, labor market data will likely play a decisive role in upcoming policy decisions. Should employment data deteriorate meaningfully, the Fed may initiate its long-anticipated rate-cut cycle.
Gold Technical Analysis

Falling inflation figures have been bullish for gold, but strong gains in risk assets continue to cap upside momentum in safe-haven trades. On the 1-hour chart, gold remains range-bound between $3,201 and $3,257. A break below $3,236 could trigger short positions with a tight stop-loss of $5–$10. Conversely, a breakout above $3,257 would confirm upward momentum, offering an opportunity to go long with a similar stop-loss range.
Support: $3,201
Resistance: $3,257
Risk Disclaimer: The views, analysis, prices, or any information expressed herein are intended solely for general market commentary and do not constitute investment advice. Traders should exercise caution and assess their own risk tolerance before making trading decisions.
WikiFX Broker
Latest News
Spring Rally in Chinese Equities Signals Potential Lift for AUS and NZD
China’s Export Resilience: A Structural Pivot Towards the 'Global South'
Silver Smashes $70: Is the "Forced Central Bank Buying" Thesis Playing Out?
JPY Forecast: Japan Raises Debt Cost Assumption to 30-Year High
Copper Smashes $12,000 Barrier in Commodity Super-Cycle Surge
Trump Intensifies Fed Pressure as Strong GDP Complicates Rate Cut Path
Credit Suisse Hit With $7.1M Fine Over Supervisory Failures
Brokers or Prop Firms, or both...
Trading.com Launches Zero-Commission Investment Account
Quotex Review 2025: Safety, Features, and Reliability
Rate Calc


