How Technical Analysis Can Improve Your Trading Game
Abstract:Technical analysis is a method used to interpret the behavior of an assets price by analyzing charts, which visually represent price movements. The primary goal of technical analysis is to identify op
Technical analysis is a method used to interpret the behavior of an assets price by analyzing charts, which visually represent price movements. The primary goal of technical analysis is to identify opportunities to buy or sell and execute trades effectively.
Charts provide insights into past price movements, enabling traders to predict probable future price directions. To enhance the effectiveness of this analysis, tools like technical indicators are commonly used. These will be discussed in greater detail later.
How to Perform Technical Analysis in Trading
To perform technical analysis in trading, you must first define the type of market you want to operate in and the financial asset you intend to trade. Additionally, consider your trading style and strategy to gain clarity on the information to be obtained and the data to analyze.
There are general aspects that can be helpful when performing technical analysis in trading:
Type of Market
Each market is unique. For instance, some markets experience faster or slower price changes, and certain markets, like futures, have distinct characteristics such as leverage levels.
Financial Asset
Different assets—such as currencies, futures contracts, stocks, or cryptocurrencies—have unique behaviors influenced by their nature. For example, the price of an Amazon stock futures contract is closely tied to the companys performance.
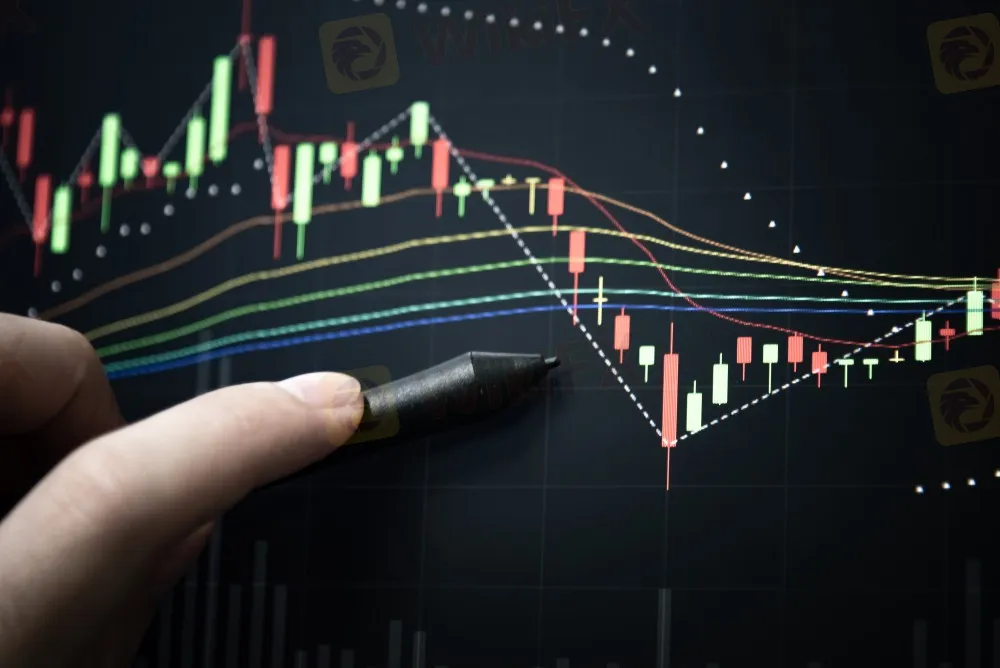
Charts
The most commonly used charts include candlestick charts, line charts, and bar charts. These formats offer various representations of price-related information.
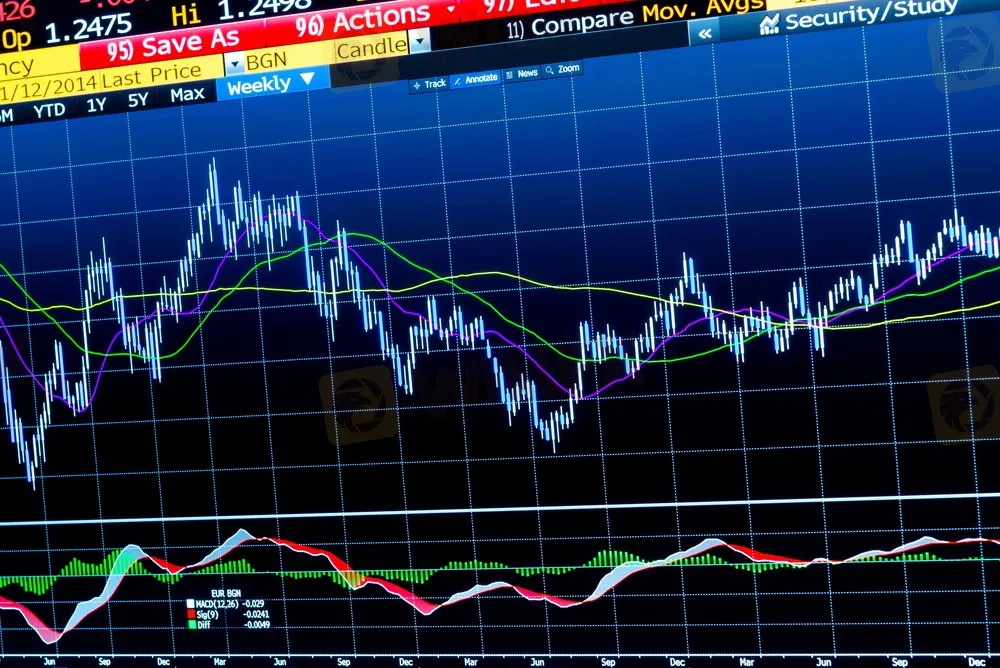
Types of Indicators
Indicators confirm trends or patterns in asset behavior. They are classified into four categories:
Volume Indicators: Reflect the number of transactions.
Trend Indicators: Highlight the overall price direction (up, down, or sideways).
Volatility Indicators: Measure the extent of price variation.
Momentum Indicators: Evaluate the speed of price movements.
Trend Lines
A trend line represents the direction of an assets price movement:
Bearish: Price moves downward.
Bullish: Price moves upward.
Sideways: Price lacks a definitive direction.
Resistance and Support
Support acts as a floor where a downward-trending price may reverse and begin to rise.
Resistance serves as a ceiling where an upward-trending price may start to decline.
How to Analyze Trading Charts
Trading charts offer two fundamental aspects to analyze:
Price
Price represents the monetary value of an asset. Charts display price fluctuations over a set period. A price increase typically reflects positive expectations about an asset's growth, while a decrease signifies negative sentiment.
To analyze charts, identify patterns and trends over specific timeframes.
Time
The timeframe determines the duration of price movements displayed on a chart. Historical data allows traders to analyze asset performance over various intervals, ranging from minutes to years. For example, day trading involves analyzing charts that show hourly or minute-by-minute price changes.
Benefits of Using Technical Analysis in Trading
One major benefit of technical analysis is its ability to track and understand small price variations over short periods. This is especially useful for trading styles like Scalping, which involves opening and closing positions within seconds or minutes.
Here are four additional benefits of technical analysis:
1. Variety of Platforms
Numerous platforms offer advanced tools for market analysis and trading. Many also allow you to customize charts and practice strategies effectively.
2. Extensive Resources
A wide array of indicators, charts, and tools are available to complement trading strategies and adapt to different styles. This diversity ensures that traders have options regardless of the market they trade in.
3. Time Efficiency
Once you master technical analysis, identifying buying or selling opportunities takes only minutes, allowing for quicker decision-making during trades.
4. Accurate Positioning
An effective trading strategy, combined with technical tools, enhances confidence in deciding when to buy or sell an asset.
Conclusion
Technical analysis is an excellent method for evaluating markets, though traders must recognize that no technical indicator is perfect. Indicators do not provide 100% accurate signals, and their predictions are based solely on historical data, which offers no certainty about future market behavior.
Despite its limitations, a well-executed technical analysis can improve profitability and enhance a traders understanding of market movements. To succeed, traders must dedicate time to refining their strategies and preparing for unexpected market behavior.
By mastering technical analysis, traders gain a powerful tool to understand charts, identify opportunities, and make informed decisions about when to buy or sell an asset.

WikiFX Broker
Latest News
RoboMarkets Review: Regulation Questions Around a Broker Facing Fresh Trading Complaints
 WikiFX
Review 2026: Deriv Regulation, Complaints, and Withdrawal Risk Signals
WikiFXStop Trading in the Middle of Ranging Forex Markets
WikiFXSTONE WALL CAPITAL Review 2026: Is This Forex Broker Safe?
WikiFXUnderstanding Day Trading: Fast Decisions, High Stress, and Zero Overnight Risk
WikiFXErrante Review: Regulation Alarms and Broker Complaints Traders Cannot Ignore
WikiFXFXTF Review 2026: FSA Regulation, MT4 Access, and Mixed Trader Reports
WikiFXFinalto Review 2026: Regulation, Trading Environment, and Platform Access
WikiFXMetaTrader 5 Expands Infrastructure With New Amsterdam Hosting for Backup Servers
WikiFXBaFin Issues Fresh Warnings Over Unauthorized Financial and Crypto Services
WikiFXRate Calc

