Today's Analysis: XAU/USD Prices Surge Above $2,400 Amid U.S. Economic Data and India's Tax Cut
Abstract:Gold prices are set to rise, driven by a busy U.S. economic schedule and interest rate cut expectations. Rebounding above $2,400 due to India's import tax cut, gold is poised for further gains. Bullish RSI indicates strong momentum, with key resistance at $2,412 and $2,450, and an all-time high of $2,483 in sight. Support levels are at $2,384 and the 50-day SMA at $2,359.
Product: XAU/USD
Prediction: Increase
Fundamental Analysis:
This week, the U.S. has a busy economic schedule with key data releases. Expectations of interest rate cuts have boosted the dollar and lowered U.S. Treasury yields. Gold prices have risen, reaching above $2,400, ending a four-day decline. Spot gold prices strongly rebounded, briefly surpassing $2,410, due to India's cut in gold and silver import taxes. The Indian government announced plans to reduce the import tax from 15% to 6%, which could boost global gold demand. Experts say this move may increase retail demand and help curb smuggling in India.
Technical Analysis:
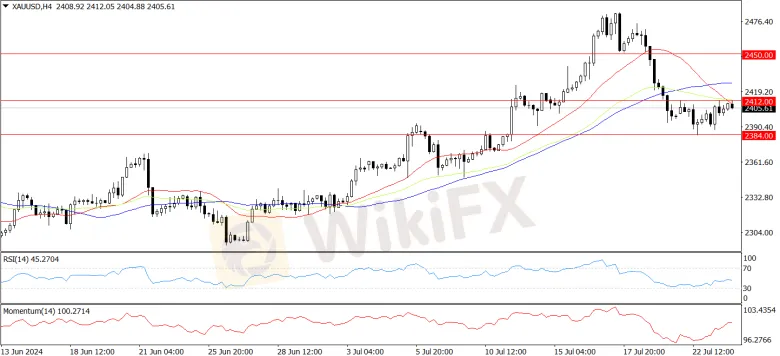
Gold prices have stopped falling, suggesting they may rise soon. The RSI is bullish, showing that buyers are gaining momentum, which could push gold prices higher. For gold to continue rising, it needs to break above $2,412. If it does, the next resistance level is $2,450, and then it may challenge the all-time high of $2,483. However, if gold falls below the July 22 low of $2,384, a deeper correction is possible. The next support level would be the 50-day Simple Moving Average (SMA) at $2,359.
Product: EUR/USD
Prediction: Decrease
Fundamental Analysis:
European Central Bank (ECB) officials have hinted at two more rate cuts this year, causing some euro buyers to step back. Now, investors are focusing on the Eurozone PMI data. This data will show if the current euro trend will continue. If the data is good, it may reduce expectations of more ECB rate cuts, possibly stopping the euro's decline. If the data is bad, the euro may face further downward pressure.
Technical Analysis:
The Euro fell early on Tuesday, pushing EUR/USD to new lows near $1.0850. The pair is trying to stabilise before important trading on Wednesday. The EUR/USD has dropped almost 1% from its recent high of $1.0948. It is still above the 200-day Exponential Moving Average (EMA) at $1.0804, but this week's drop makes it vulnerable to further declines as it moves back into a downward trend.

Product: USD/JPY
Prediction: Decrease
Fundamental Analysis:
The USD/JPY pair trades higher around $155.85, ending a two-day losing streak early Wednesday in Asia. However, the pair's gains might be limited due to growing speculation that the Bank of Japan (BoJ) will continue raising interest rates to strengthen the yen. According to Reuters, Toshimitsu Motegi, a senior ruling party official, said the BoJ should clearly communicate its intent to normalize monetary policy with steady rate hikes. This expectation might boost the Japanese Yen (JPY) against the US Dollar (USD) for now.
Technical Analysis:
Momentum favours sellers, as shown by the RSI dropping below the neutral 50 line. This means the USD/JPY is likely to move downwards. The first support level is at $155.00. If it breaks below this, it could drop to the June 4 low of $154.55, then the May 3 low of $151.86, and further down to the March 8 low of $146.48. However, if buyers push the rate above $156.33, it could rise further. The next resistance level would be at $157.00.

Product: BTC/USD
Prediction: Decrease
Fundamental Analysis:
Bitcoin's recent drop is due to Mt. Gox started to repay over 140,000 bitcoins, worth about $8.5 billion, to its creditors. According to a Telegram group of Mt. Gox creditors have started receiving Bitcoin and Bitcoin Cash (BCH) repayments via the Kraken crypto exchange. At the same time, the U.S. government moved 58.74 bitcoins, worth nearly $4 million, to Coinbase Prime, leading to speculation about its purpose.
Technical Analysis:
From a technical perspective, Bitcoin bounced back from the 50-day and 100-day moving averages over the weekend, reaching a recent high of around $68,486. This provided support for its price. However, the hanging man candlestick pattern that formed overnight suggested a possible downward trend, which has now materialised. Immediate support lies between $64,370 and $63,737, provided by the 50-day and 100-day moving averages. If Bitcoin breaks below this range, the next support to watch is at $61,751, before the 200-day moving average just above the psychological level of $60,000.

Market Analysis Disclaimer:
The market analysis provided by KVB Prime Limited is for informational purposes only and should not be construed as investment advice or a recommendation to buy or sell any financial instrument. Trading forex and other financial markets involves significant risk, and past performance is not indicative of future results.
KVB Prime Limited does not guarantee the accuracy, completeness, or timeliness of the information provided in the market analysis. The content is subject to change without notice and may not always reflect the most current market developments or conditions.
Clients and readers are solely responsible for their own investment decisions and should seek independent financial advice from qualified professionals before making any trading or investment decisions. KVB Prime Limited shall not be liable for any losses, damages, or other liabilities arising from the use of or reliance on the market analysis provided.
By accessing or using the market analysis provided by KVB Prime Limited, clients and readers acknowledge and agree to the terms of this disclaimer.
RISK WARNING IN TRADING
Transactions via margin involve products that use leverage mechanisms, carry high risks, and are certainly not suitable for all investors. THERE IS NO GUARANTEE OF PROFIT on your investment, so be wary of those who guarantee profits in trading. You are advised not to use funds if you are not prepared to incur losses. Before deciding to trade, ensure that you understand the risks involved and also consider your experience.

Read more

EGRs vs ETFs - Which is a Better Way to Invest in Gold?
The National Stock Exchange (NSE) recently launched Electronic Gold Receipts (EGRs), a digital way to invest in exchange-backed physical gold. A little less than four years ago, the Bombay Stock Exchange (BSE) introduced EGRs in October 2022. Gold Exchange Traded Funds (ETFs), another useful way to invest in gold, have already been in the market for a long time. So, the debate keeps happening on EGRs vs ETFs among gold buyers in India. In this article, we have defined and compared these two to find which one benefits you more.

LOYAL PRIMUS Review: Allegations of Account Disablement and Withdrawal Denials
Did your attempt to withdraw funds from the LOYAL PRIMUS platform lead to your account deactivation by the broker? Did the broker prevent you from withdrawing when you made profits? Did the broker cancel your withdrawal application by accusing you of suspicious trading activity? These allegations have grown in numbers on independent broker review tools such as WikiFX. In this LOYAL PRIMUS review article, we have examined all these allegations thoroughly.

Top Secrets Why the Indian Government Appeals for a NO Gold Purchase
Is it the effect of ongoing Israel-Iran-US conflict, the surging import of the yellow metal or any other economic indicators that the Indian Prime Minister made an appeal to the countrymen to stop buying gold for a year? Addressing the public rally, the PM also advised postponing travel, limiting the use of petrol, diesel and cooking oil, and transitioning to the work from home model as much as possible. He categorically mentioned: Save dollars, conserve India’s foreign exchange reserves. Read on!

India’s Love Affair with Gold: Investment Demand Rises 40% of Consumption in CY25
In the latest news that further establishes India as the destination for gold, the data issued by CareEdge Ratings demonstrated the country’s never-ending love for the yellow metal with a record investment surge of approximately 40% of overall consumption in Calendar Year 2025. This is arguably the highest in recent times. The ETF inflows alone added 37.5 tonnes, surpassing the combined investment of the last ten years. According to the ratings agency, geopolitical uncertainty and record prices made people quickly move away from jewellery.
WikiFX Broker
Latest News
21 Arrested in Melaka Raid on Fake Stock Investment Call Centre
 WikiFX
Octa Review: Profit Withdrawals, Account Blocks, and Broker Risk Signals
WikiFXSpotting Forex Ponzi Schemes and Confidence Scams Before You Deposit
WikiFXWhat Indian Beginners Should Check Before Choosing a Forex Broker
WikiFXINVESTIZO Review: Unregulated Broker Under Fire Over Withdrawals and Profit Cancellation
WikiFXBuild Trading Discipline Using a Bar-by-Bar Blind Test
WikiFXBreak the Habit of Adding to Your Losing Trades
WikiFXBehind the Regulated Facade: Is ACCUMARKETS Freezing Out Successful Traders?
WikiFXFBS Review: CySEC & ASIC Licensed, Yet Scored 2.51 , What's Really Going On?
WikiFXIpoh Businessman Loses RM1.25 Million in Crypto Group that Promised High Returns
WikiFXRate Calc

