Mai hui MHmarkets: June 20, 2023-MHM European Perspective
Abstract:On Tuesday (June 20), spot gold weakened slightly during the Asian session, reaching a three day low of $1945.02 per ounce, approaching the 100 day moving average, currently trading around $1948.82 per ounce.

Market Overview
On Tuesday (June 20), spot gold weakened slightly during the Asian session, reaching a three day low of $1945.02 per ounce, approaching the 100 day moving average, currently trading around $1948.82 per ounce. This week will usher in a number of Federal Reserve officials for the first time since the June interest rate resolution, the market is expected to be mostly expected to hawkish, to the dollar to provide rebound momentum, put gold prices under pressure. As the 21-day SMA continues to suppress gold prices, the short term gold price shocks bearish. However, concerns about the global economic outlook still give gold prices to provide some safe-haven support.
U.S. crude oil is slightly weaker and is currently trading near $71.25 per barrel, with Iranian crude exports and oil production hitting a new high in 2023. JPMorgan Chase lowered its average estimate for Brent oil prices this year to $81 a barrel from the previous $90.
In the week ended June 14, Russian refining facilities processed 5.49 million barrels of crude oil per day, which was up nearly 194,000 bpd from the previous week and the highest processing rate since the second half of April. The factor was also a drag on oil prices.
In addition, China cut its one-year and five-year loan market offer rates (LPR) less than some had expected, further raising concerns about the outlook for oil demand.
Jun Rong Yeap, market strategist at IG in Singapore, said, “Downside risks to global growth remain a key issue for the oil demand outlook... Risk sentiment remains stable ahead of a series of hawkish Fed speeches this week.”
This trading day will see the St. Louis Fed President Bullard and New York Fed President Williams' speeches, investors need to focus on. In addition, pay attention to the performance of the U.S. housing market data.
After the Fed's hawkish stance last week to suspend monetary policy, the market is also watching Powell's congressional testimony on Wednesday and Thursday, investors need to pay attention to the changes in market expectations.
MHMarkets strategy is only for reference and not for investment advice. Please carefully read the statement at the end of the text. The following strategy will be updated at 15:00 on June 20, Beijing time.
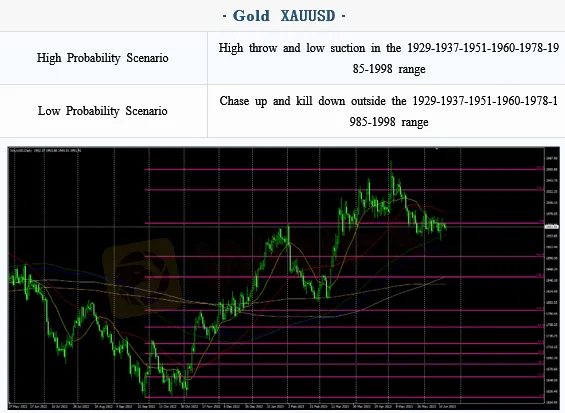
Intraday Oscillation Range: 1929-1937-1951-1960-1978-1985-1998
Overall Oscillation Range: 1730-1756-1780-1801-1817-1833-1856-1873-1889-1903-1911-1929-1937-1951-1960-1978-1985-1998-2007-2016-2033-2046-2057-2066-2077-2089-2097-2100
In the subsequent period of spot gold, 1929-1937-1951-1960-1978-1985-1998 can be operated as the bull and bear range; High throw low suction in the range, chase up and kill down outside the range!
Note: The above strategy was updated at 15:00 on June 20. This policy is a daytime policy. Please pay attention to the policy release time.
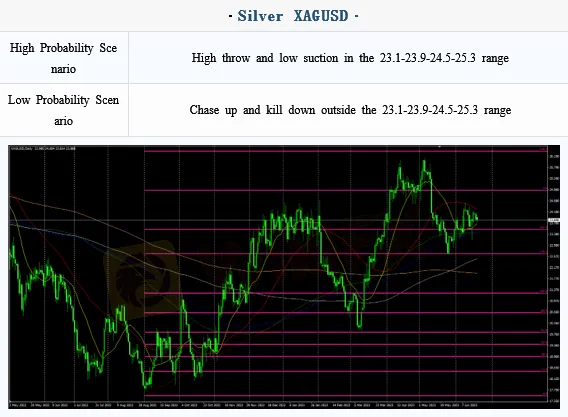
Intraday Oscillation Range: 23.1-23.9-24.5-25.3
Overall Oscillation Range: 19.7-20.1-20.6-21.5-22.3-23.1-23.9-24.5-25.3-26.1-26.6-27.3
In the subsequent period of spot silver, 23.1-23.9-24.5-25.3 can be operated as the bull and bear range. High throw and low suction in the range, chase up and kill down outside the range!
Note: The above strategy was updated at 15:00 on June 20. This policy is a daytime policy. Please pay attention to the policy release time.
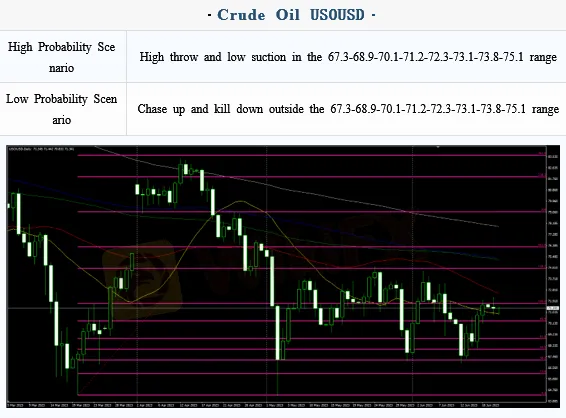
Intraday Oscillation Range: 67.3-68.9-70.1-71.2-72.3-73.1-73.8-75.1
Overall Oscillation Range: 62.1-63.7-64.5-65.8-66.9-67.3-68.9-70.1-71.2-72.3-73.1-73.8-75.1-77.9-78.5-79.9-80.7-82.3-83.5-85.3-87.3-89.1 In the subsequent period of Crude Oil, 67.3-68.9-70.1-71.2-72.3-73.1-73.8-75.1 can be operated as the bull and bear range. High throw and low suction in the range, chase up and kill down outside the range!
Note: The above strategy was updated at 15:00 on June 20. This policy is a daytime policy. Please pay attention to the policy release time.
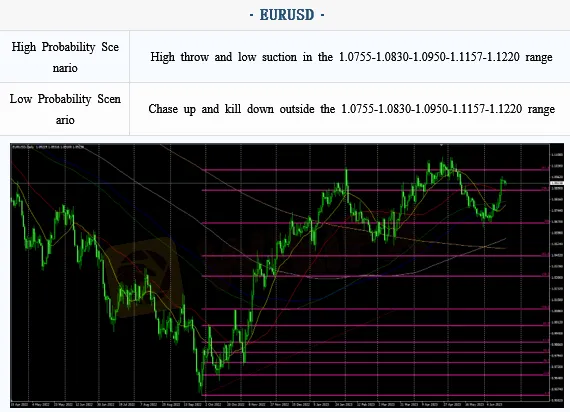
Intraday Oscillation Range: 1.0755-1.0830-1.0950-1.1157-1.1220
Overall Oscillation Range: 1.0290-1.0360-1.0460-1.0570-1.0690-1.0755-1.0830-1.0950-1.1157-1.1220-1.1303
In the subsequent period of EURUSD, 1.0755-1.0830-1.0950-1.1157-1.1220 can be operated as the bull and bear range. High throw and low suction in the range, chase up and kill down outside the range!
Note: The above strategy was updated at 15:00 on June20. This policy is a daytime policy. Please pay attention to the policy release time.
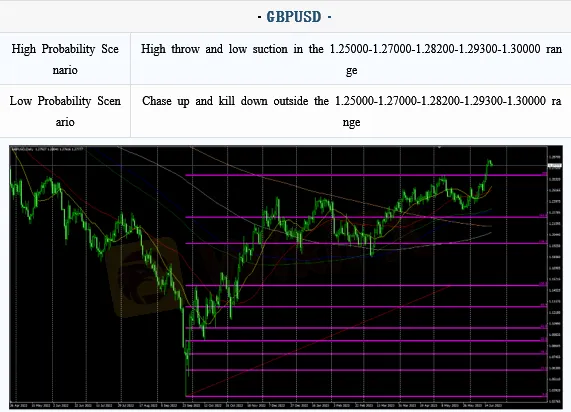
Intraday Oscillation Range: 1.25000-1.27000-1.28200-1.29300-1.30000
Overall Oscillation Range: 1.1610-1.1830-1.1920-1.2030-1.2135-1.2250-1.2375-1.2400-1.2470-1.25000-1.27000-1.28200-1.29300-1.30000-1.30600
In the subsequent period of GBPUSD, 1.25000-1.27000-1.28200-1.29300-1.30000 can be operated as the bull and bear range. High throw and low suction in the range, chase up and kill down outside the range!
Note: The above strategy was updated at 15:00 on June 20. This policy is a daytime policy. Please pay attention to the policy release time.

Read more

MHMarkets:2024.03.29 MHM European Time Analysis
Fed Governor Christopher Waller's recent comments have highlighted a cautious stance towards adjusting interest rates, marking a significant moment for the financial markets.

MHMarkets:2024.03.28 MHM European Time Analysis
In the forex market, stability was the theme for the U.S. dollar index, holding firm at 104.30. Minor fluctuations were observed across major currency pairs: the Euro slightly weakened against the dollar, closing at 1.0827

MHMarkets:2024.03.27 MHM European Time Analysis
In the latest market wrap focusing on the foreign exchange sector, the U.S. dollar index showed minimal movement, holding at 104.31.

MHMarkets:March 27, 2024 Economic Highlights
On Tuesday, due to February's US durable goods orders growth exceeding expectations and an optimistic economic growth outlook for the first quarter in the US, the US dollar index initially fell but then rose, briefly touching below the 104 mark before recovering during the US trading session, closing up 0.07% at 104.29.
WikiFX Broker
Latest News
Is Fortune Prime Global Legit Broker? Answering concerns: Is this fake or trustworthy broker?
AssetsFX Regulation: A Complete Guide to Licenses and Trading Risks
ZaraVista Legitimacy Check: Addressing Fears: Is This a Fake Broker or a Legitimate Trading Partner?
ZarVista User Reputation: Looking at Real User Reviews to Check if It's Trustworthy
TP Trader Academy ‘The Axis Event’: Pioneering Trading Education at the Heart of Tech and Data
S. Africa Energy Gridlock: Glencore Proposal Stalls Amid Regulatory Clash
Capital.com Review: Is Your Money Locked Inside this Broker?
FxPro Broker Analysis Report
Pinnacle Pips Forex Fraud Exposed
Grand Capital Review 2026: Is this Broker Safe?
Rate Calc

