Mohicans markets:MHM European Market
Abstract:On Wednesday (March 15), the spot gold fell slightly in the Asian session, and it is currently trading near the 1900 mark. The overnight data shows that the inflation in the United States is still at a high level, which increases the expectation of the Federal Reserve to raise interest rates by 25 basis points next week. The rebound in the yield of US Treasuries put pressure on the gold price. However, the fear caused by the collapse of Silicon Valley Bank has not completely dissipated, and the

Market Overview
On Wednesday (March 15), the spot gold fell slightly in the Asian session, and it is currently trading near the 1900 mark. The overnight data shows that the inflation in the United States is still at a high level, which increases the expectation of the Federal Reserve to raise interest rates by 25 basis points next week. The rebound in the yield of US Treasuries put pressure on the gold price. However, the fear caused by the collapse of Silicon Valley Bank has not completely dissipated, and the Federal Reserve is expected to be no longer particularly hawkish, and the geopolitical tension will also provide safe-haven support for gold prices.
US crude oil was trading near US $71.80/barrel; The oil price fell by more than 4% on Tuesday, hitting the lowest level in three months. Earlier, the inflation report of the United States and the recent collapse of Silicon Valley Bank raised concerns about the new financial crisis, which may reduce the future oil demand, and the OPEC monthly report showed that the global oil market may have a slight oversupply in the second quarter; Data released in the morning showed that the US crude oil inventory increased last week, which also limited the rise of oil prices.
This trading day will announce US PPI data in February and retail sales data. The market expects that PPI growth will slow down and retail sales will decline on a month-on-month basis, which is still biased towards bullish gold prices. During the day, we will focus on the annual PPI rate of February in the United States, EIA data, and IEA's monthly crude oil market report.
The Mohicans Markets strategy is for reference only and not for investment advice. Please read the statement clauses at the end of the text carefully. The following strategy was updated at 15:00 Beijing time on March 15, 2023.
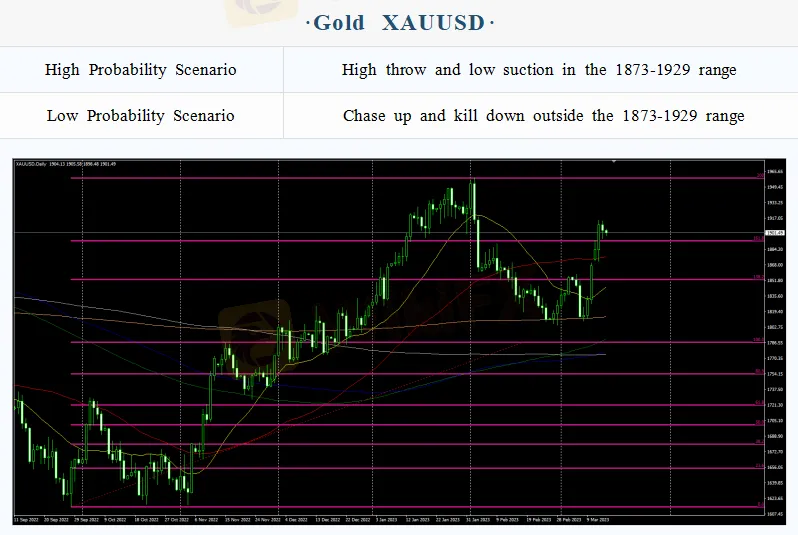
Intraday Oscillation Range: 1873-1889-1903-1911-1929
Overall Oscillation Range: 1730-1756-1780-1801-1817-1833-1856-1873-1889-1903-1911-1929-1937-1951-1978-1985
In the subsequent period of spot gold, 1873-1889-1903-1911-1929 can be operated as the bull and bear range; High throw low suction in the range, chase up and kill down outside the range!
Note: The above strategy was updated at 15:00 on March 15. This policy is a daytime policy. Please pay attention to the policy release time.
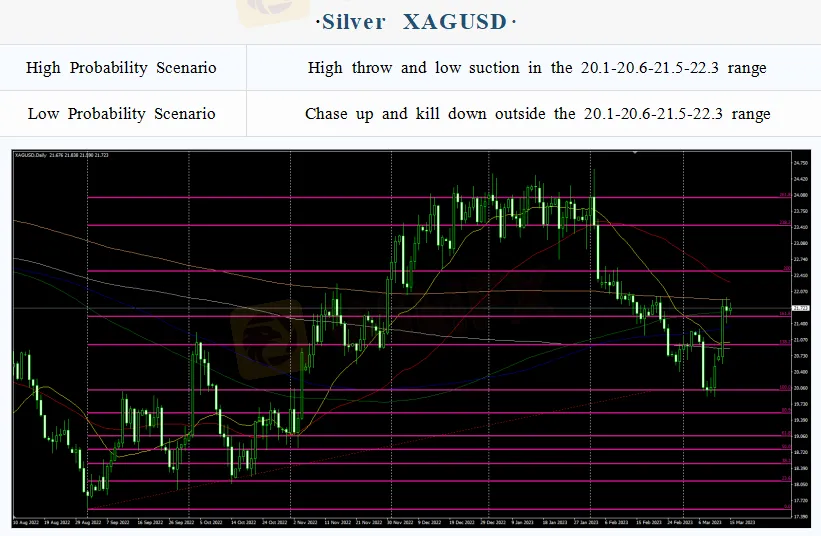
Intraday Oscillation Range: 20.1-20.6-21.5-22.3
Overall Oscillation Range: 19.7-20.1-20.6-21.5-22.3-23.1-23.9-24.5-25.3-26.1
In the subsequent period of spot silver, 20.1-20.6-21.5-22.3 can be operated as the bull and bear range. High throw and low suction in the range, chase up and kill down outside the range!
Note: The above strategy was updated at 15:00 on March 15. This policy is a daytime policy. Please pay attention to the policy release time.
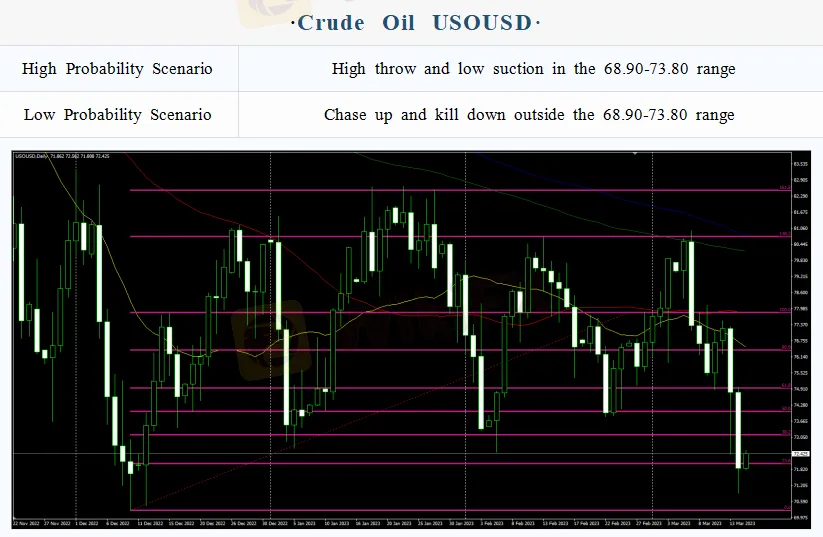
Intraday Oscillation Range:68.9-70.1-71.2-72.3-73.1-73.8
Overall Oscillation Range: 68.9-70.1-71.2-72.3-73.1-73.8-75.1-77.9-78.5-79.9-80.7-82.3-83.5-85.3
In the subsequent period of US crude oil, 68.9-70.1-71.2-72.3-73.1-73.8 can be operated as the bull and bear range. High throw and low suction in the range, chase up and kill down outside the range!
Note: The above strategy was updated at 15:00 on March 15. This policy is a daytime policy. Please pay attention to the policy release time.
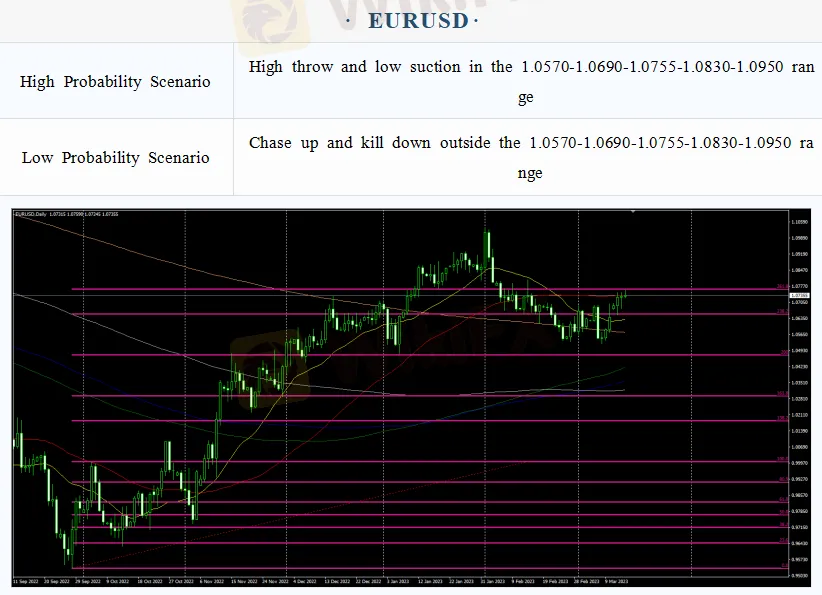
Intraday Oscillation Range: 1.0570-1.0690-1.0755-1.0830-1.0950
Overall Oscillation Range: 1.0290-1.0360-1.0460-1.0570-1.0690-1.0755-1.0830-1.0950-1.1157-1.1220-1.1303
In the subsequent period of EURUSD, 1.0570-1.0690-1.0755-1.0830-1.0950 can be operated as the bull and bear range. High throw and low suction in the range, chase up and kill down outside the range!
Note: The above strategy was updated at 15:00 on March 15. This policy is a daytime policy. Please pay attention to the policy release time.
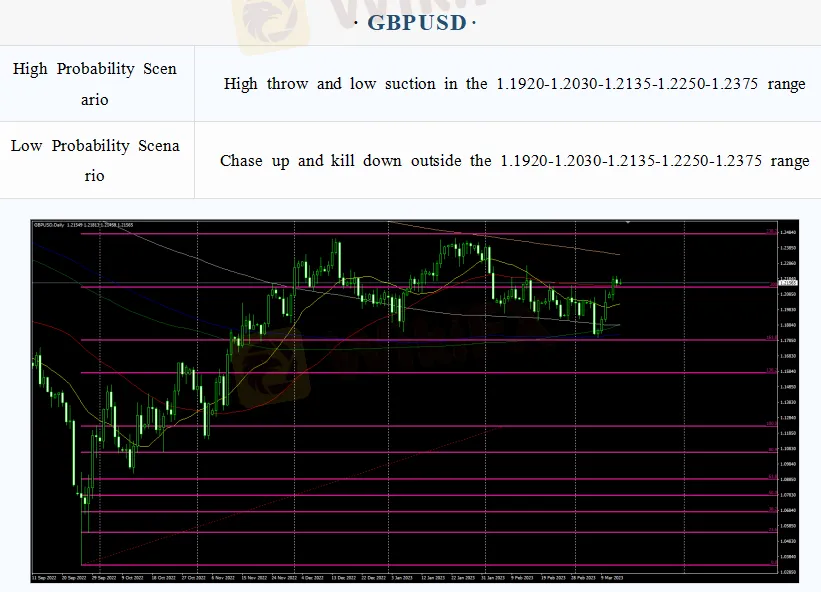
Intraday Oscillation Range: 1.1920-1.2030-1.2135-1.2250-1.2375
Overall Oscillation Range: 1.1610-1.1830-1.1920-1.2030-1.2135-1.2250-1.2375-1.2400-1.2470-1.2550
In the subsequent period of GBPUSD, 1.1920-1.2030-1.2135-1.2250-1.2375 can be operated as the bull and bear range. High throw and low suction in the range, chase up and kill down outside the range!
Note: The above strategy was updated at 15:00 on March 15. This policy is a daytime policy. Please pay attention to the policy release time.

Read more

Mohicans markets:MHM European Market
Spot gold weakened slightly during the Asian session on Thursday (April 6), hitting a two-day low of $2007.89 per ounce and now trading near $2014.15. A series of weak economic data has fueled fears of an impending recession in the US, giving safe-haven support to the dollar. And some dollar shorts took profits, and gold bulls also took profits ahead of Good Friday and the non-farm payrolls data, putting pressure on gold prices.

Mohicans markets:MHM Today News
On Wednesday, as the less-than-expected March "ADP" data and non-manufacturing PMI data fueled market concerns about an economic slowdown and spurred bets that the Federal Reserve could slow interest rate hikes. Spot gold continued to brush a new high since March last year, which was the highest intraday to $2032.13 per ounce, and then retracted most of the day's gains, finally closing up 0.01% at $2020.82 per ounce; spot silver hovered around $25 during the day, finally closing down 0.21% at $2

Mohicans markets:MHM European Market
Spot gold oscillated slightly lower during the Asian session on Tuesday (April 4) and is currently trading around $1980.13 per ounce. The dollar index rebounded mildly after a big drop overnight, putting pressure on gold prices. However, this week will see the non-farm payrolls report, there is no important economic data out on Tuesday, and the market wait-and-see sentiment is getting stronger.

Mohicans markets :MHM Today News
On Monday, in OPEC + members unexpectedly cut production reignited market concerns about long-term inflation and sparked uncertainty about the Fed's response, the dollar index once up to the 103 mark, and then on a "vertical roller coaster", giving back all the gains of the day and once lost 102 mark, finally closed down 0.53% at 102.04; U.S. 10-year Treasury yields rose and then fell, as data showed that the U.S. economy continues to slow, it fell sharply in the U.S. session, and once to a low
WikiFX Broker
Latest News
ZarVista Legitimacy Check: Addressing Fears: Is This a Fake Broker or a Legitimate Trading Partner?
Gold's Historic Volatility: Liquidation Crash Meets Geopolitical Deadlock
Treasury Yields Surge as Refunding Expectations Dash; Warsh 'Hawk' Factor Looms
The Warsh Dilemma: Why the New Fed Nominee Puts Fiscal Plans at Risk
Eurozone Economy Stalls as Demand Evaporates
South African Rand (ZAR) on Alert: DA Leadership Uncertainty Rattles Markets
Nigeria Outlook: FX Stability Critical to Growth as Fiscal Revenue Surges
AUD/JPY Divergence: Aussie Service Boom Contrasts with Japan's Fiscal "Truss Moment"
ZarVista Regulatory Status: A Deep Look into Licenses and High-Risk Warnings
KODDPA Review: Safety, Regulation & Forex Trading Details
Rate Calc

