Measured Move Suggests Upside Potential for Gold
Abstract:Owning gold has required patience these last two years. After surging following the onset of COVID and peaking above $2,000 per ounce back in August 2020, gold has churned in the time since and is currently trading -15% below its all-time highs. As a result of finding support at a critical price zone, the gold trend has turned positive.

Owning gold has required patience these last two years. After surging following the onset of COVID and peaking above $2,000 per ounce back in August 2020, gold has churned in the time since and is currently trading -15% below its all-time highs. As a result of finding support at a critical price zone, the gold trend has turned positive.
Jumping off a key support level, gold initiates a positive turnaround above yesterday's high. There are signs that the small correction's bottom has been reached and that gold is now poised to move higher. Watch for further indications of growth and new optimistic cues going forward. In addition, a decline below this support area (shown below) will be negative.
At the 88.6% Fibonacci Retracement Line, gold found support.
Yesterday's bottom of 1,809.33, where gold found support, marked the conclusion of the 88.6% Fibonacci retracement of the most recent five-day rise. The 200-Day EMA, currently at 1,805.64, a 61.8% Fibonacci retracement level, as well as prior notable swing lows and highs, were all previously recognized support zones that included that low. The bull trend is expected to continue given last week's positive response off the support zone.
Possible Formation of a Double Bottom
A possible positive double bottom trend turnaround pattern may now be developing in the overall picture. The second bottom is formed by yesterday's swing low, and a breakthrough above this week's high of 1,858.33 initiates. Remember that until there is a breakthrough, the pattern is only conceivable and could be a double bottom. Around 1,911 is the traditional counting goal or aim from the design.
If attained, that goal offers significant upside potential and corresponds to the downtrend's 61.8% Fibonacci retracement level at 1,900.51.
the traditional measured move targets 1,911
The present steady advance off yesterday's bottom is of concern. Off the most recent trend bottom of 1,804.68, it is the second step up. The trend's initial run upward began at the low and came to a close at this week's high. If the goal is met, gold will reach 1,863 and will also have completed a 38.2% Fibonacci retracement at 1,863.90. If gold continues climbing, this is a goal zone with a high likelihood.
Higher goal zones should ultimately be achieved, though, given the importance of the recent support zone, the double bottom pattern, and particularly the 200-Day EMA. The first higher goal zone, which spans the range from 1,877 to 1,882 as shown on the chart, was determined using Fibonacci convergence price levels. The double bottom goal at 1,911 and the price region of the 61.8% Fibonacci retracement at 1,900.51 are higher still.


Read more
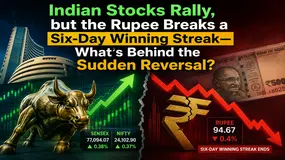
Indian Stocks Rally, but the Rupee Breaks a Six-Day Winning Streak—What's Behind the Sudden Reversal
Indian stock indices today, i.e., June 22, 2026, recorded growth, with the BSE Sensex rising 297.11 points to 77,094.07, recording a 0.38% jump. On the other hand, the NSE Nifty hit approximately 24100, largely aided by broad-based purchases across sectors, except for consumer durables and fast-moving consumer goods (FMCG). The Nifty grew by 89.80 points (0.37%+) to 24,102.90.
ALFX Review 2026: Fast Withdrawals, Easy Deposits—Reality or Hype?
ALFX, a new-age brokerage firm with around two years of service track record, seemed to have recorded around 30 reviews by users worldwide, including those in India. While some question the deposit & withdrawal process based on their poor experience, some appreciate its smooth payment services and impressive spreads. This ALFX review article takes both positive and negative user feedback for the broker. This will allow you to make an informed financial decision.

Lost Your Capital by Clicking on a Forex Trading Link? This is the Latest Scam Trend!
Newspaper after newspaper, social media platforms after social media platforms, we often come across the term forex trading scam. It’s taking a vicious shape. Unknown profiles constantly jam your phones or social media accounts with luring messages of guaranteed and astonishing returns that you may not have heard of before. So, what many do? They click on the link and get into a dreamy, yet fake world that somehow appears much later. More so, in many cases, after the scam. The case of XPO.ru last year, where users were told to click on a link to start forex trading, led to the siphoning of as much as INR 3,100 crore, leaving affected investors and the authorities puzzling over the incident. While the XPO scam was a massive incident, there has not been a shortage of these incidents. The Internet is flooded with stories concerning forex scams of this nature. In this article, we take a close look at several such scams.

Wundersys vs tradgrip: Two Offshore Newcomers Go Head to Head — and Neither Brings Home a Trophy
Some broker comparisons end with a confident "go with this one." This is not one of them — and that honesty is exactly what makes it worth reading. Wundersys and tradgrip are two young, offshore-registered brokers that keep popping up in front of beginner traders, often through aggressive online marketing. Both promise the usual buffet: tight spreads, generous leverage, multiple account tiers. And both, according to WikiFX, sit near the very bottom of the safety scale. So instead of crowning a champion, this comparison is really about something more useful: learning to read the warning signs, understanding the small differences that still matter, and knowing why "the better of two risky options" is still a conversation about risk.
WikiFX Broker
Latest News
Review 2026: Interactive Brokers Regulation, Complaints, and Platform Access
 WikiFX
Review 2026: STMARKET Regulation, MT5 Access, and Withdrawal Complaint
WikiFXHow the Bullet Theory Fixes the Habit of Overtrading
WikiFXEMIRAX MARKETS Review 2026: Unregulated Status, High Leverage, and Withdrawal Complaints
WikiFXEMAR MARKETS Review 2026: Complaints, High Leverage, and Withdrawal Risk Signals
WikiFXRCG Markets Review 2026: Is This Forex Broker Safe?
WikiFXThai Authorities Seize Assets in Forex Ponzi Investigation
WikiFXTrading the Forex Range: How to Find Boundaries and Avoid Middle Entries
WikiFXHMFS Review 2026: Should You Trade with This Broker?
WikiFXDSI Exposes Alleged Forex Empire Behind Billion Baht Scam, Money Laundering and Political Connection
WikiFXRate Calc

