US OPENING BELLUS OPENING BELL 01-02-2023
Abstract:EUROPEAN SHARES REMAIN FLAT AHEAD OF THE KEY FED MEETING; EUROZONE INFLATION SLOWS MORE THAN EXPECTED WHILE THE USD AND VIX REMAIN AT PERIOD LOWS.

EUROPEAN SHARES REMAIN FLAT AHEAD OF THE KEY FED MEETING; EUROZONE INFLATION SLOWS MORE THAN EXPECTED WHILE THE USD AND VIX REMAIN AT PERIOD LOWS.
The opening bell refers to the moment a securities exchange opens for its normal daily trading session. Major European equities traded around parity this morning ahead of the US session, with the Dax advancing 0.11%, the Cac40 0.03% and the Eurostoxx 0.21%.
The market is waiting to see the outcome of the FED meeting this evening, with investors focusing on what Powell will say in his press conference. In particular, attention will need to be paid to possible references to any wording regarding future rate hikes and the timing with which these rates will remain so high. The market has recently risen by ‘reading’ the FED meeting as dovish in anticipation. So its performance will be determined as always by the degree to which these expectations will or will not be disappointed.
In the meantime, positive data for the Eurozone arrived in the morning, with inflation falling more than expected. Specifically, the annual figure came in at 8.5% against the expected 9%, while the monthly figure came in at -0.4% against the expected -0.3%. These data should not cause the ECB to alter its planned 50bp rate hike this week, but they could certainly affect the central banks forward guidance.
The Eurozone consumer price index dropped by 0.4% month-on-month during the period, matching the decrease seen in December. Economists had forecast a decline of 0.3%. Somewhere, the USD continues to trade on period lows around 101 (dollar index), as does the VIX, which doesnt seem to want to rise above the 20 mark. Beware of this data, volatility is very compressed at the moment, and these compressions always occur before solid expansions.
With regards to the macroeconomic calendar, investors attention today will be focused on the FED meeting, as already mentioned. Still, following the ADP non-farm employment change, the ISM manufacturing PMI, crude oil inventories and JOLTs job openings will also be necessary.
EURUSD, M15
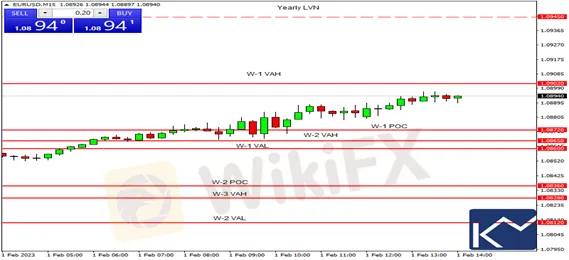
The EURUSD recovered all yesterday mornings losses and closed positive. As for today, the most significant intraday support area is between the W-1 POC and the W-1 VAL. In contrast, the most critical intraday resistance is the W-1 VAH. From a technical point of view, as long as prices remain above the support, the most likely scenario is a continuation of the rise toward the resistance. If prices break the resistance and consolidate above it, they could target the yearly LVN around the 1.0945 mark. On the other hand, if prices drop below the W-1 VAL, they could fall to the W-2 POC.
Main intraday support areas where to look for long trades in case of a bullish candlestick pattern or short trades in case of a bearish candlestick pattern: 1.0872-1.0860, 1.0836, 1.0828, 1.0812.
Main intraday resistances areas where to look for short trades in case of a bearish candlestick pattern or long trades in case of a bullish candlestick pattern: 1.0902, 1.0945.
S&P500, M30
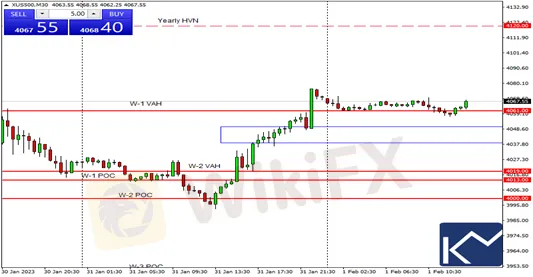
The S&P index rose above the resistance in the 4039-4050 area and posted a precise pullback before stretching above the W-1 VAH. As for today, the 4039-4050 area is the most significant intraday support. In contrast, the most crucial resistance is the yearly HVN. From a technical standpoint, as long as prices remain above the support, the most likely scenario is a continuation of the rise toward the resistance. On the flip side, if the index drop below the support, further declines could target the W-2 VAH.
Main intraday support areas where to look for long trades in case of a bullish candlestick pattern or short trades in case of a bearish candlestick pattern: 4061, 450-4039, 4019.
Main intraday resistances areas where to look for short trades in case of a bearish candlestick pattern or long trades in case of a bullish candlestick pattern: 4120.
Check some Key meaning:
POC= Point of Control
VAH= Value Area High
VAL= Value Area Low
LVN= Low Volume Node
HVN= High Volume Node
W-1= last week
W-2= two weeks ago
W-3= three weeks ago
D-1= yesterday
D-2= two days ago
D-3= three days ago


Read more
Spreadex Review: Wider Spread & Unexplained Account Closure Allegations for This 2-Decade-Old Broker
Did you incur trading losses on the Spreadex platform due to wider spreads? Have you experienced delays in trade processing by the United Kingdom-based forex broker? Has your Spreadex trading account been closed without any explanation? You are not alone! Many traders have expressed concerns on online broker review platforms. In this Spreadex review 2026, we have covered user allegations and provided a regulatory framework the broker operates under.
cTrader White Label Platform: A Practical Guide for Broker Evaluation and Multi-Asset Expansion in 2
A broker can launch a white-label platform quickly and still fail the first serious operating test. The failure often begins quietly: an assets expansion has been approved, the client app is branded, and a new account journey looks complete. Then a client asks why a trade-related status, funding hand-off, or account restriction looks different across channels. Support cannot see the same reference trail as operations. The product owns the screen, but no one owns the explanation. The issue is not a missing feature. It is an untested operating model. That is why a cTrader white label platform should be evaluated as a route to a multi-asset service - not as a shortcut to a more attractive terminal. The central question is whether the broker can add instruments, client channels, integrations, and service capacity without making its controls harder to operate or explain.

Is TradingPRO Safe? FCA Warning, Indonesia Blocklist Evidence, and 7 Checks Before You Deposit
This Trading Pro broker review checks the FCA warning, Indonesia blocklist evidence, licence claims, and what South Asian users should verify before depositing.
MT4 White Label Cost in 2026: What Brokers Must Budget Beyond the Platform Fee
The visible fee in an MT4 white label proposal is rarely the real cost of operating it. For an existing broker, the decision is not simply whether an MT4 white label platform is “cheap” or “expensive.” The real question is whether the commercial model remains viable after integration, support, data, client migration, compliance, and exit costs are included. That is why an MT4 white label cost review should be built as a 24- to 36-month operating case. It should compare three credible choices: 1. Keep the present MT4 setup and improve its weakest controls. 2. Replace the MT4 white label provider but retain the client proposition. 3. Migrate selected clients or products to another platform while running MT4 in parallel. This guide explains how to build that case without relying on headline prices or generic vendor claims.
WikiFX Broker
Latest News
ForexMart Review: Profit Canceled, Principal Withheld, and a Broker Warning Traders Cannot Ignore
 WikiFX
How a 'Legitimate' Investment Became a RM67.5 Million Ponzi Scheme That Scammed 206 Investors
WikiFXTitan Capital Markets Review 2026: Complaints, Withdrawals, and Severe Risk Signals
WikiFXRupee Hits Two-Week High as RBI Defends 97 Mark
WikiFXSingapore Dollar Holds Tight Range as FOMC Looms
WikiFXcTrader White Label Platform: A Practical Guide for Broker Evaluation and Multi-Asset Expansion in 2
WikiFXWhat a divided Fed means for investors
WikiFXReview 2026: Dollars Markets Regulation, Withdrawal Complaints, and Platform Risks
WikiFXCapital Guard Liquidated: $17.4m Raised, Most Funds Gone
WikiFXPocket Broker Review: Is Your Deposit Safe?
WikiFXRate Calc

