WIKIFX REPORT: Ichimoku Cloud Analysis 20.07.2022 (EURUSD, USDCAD, NZDUSD)
Abstract:The Ichimoku Cloud is a group of technical indicators that displays momentum and trend direction, as well as levels of support and resistance. It accomplishes this by averaging several averages and charting them. Additionally, it computes a "cloud" using this data in an effort to predict potential future areas of support and resistance for the price.
The Ichimoku Cloud is a collection of technical indicators that show support and resistance levels, as well as momentum and trend direction. It does this by taking multiple averages and plotting them on a chart. It also uses these figures to compute a “cloud” that attempts to forecast where the price may find support or resistance in the future.
Let's take a look at the recent Ichimoku Cloud Analysis
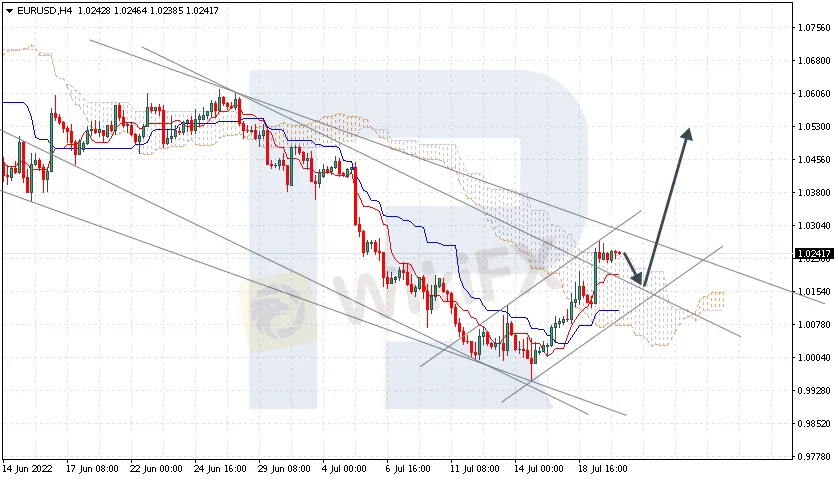
EURUSD, “Euro vs US Dollar”
EURUSD is about to break the bearish channel‘s upside border. The instrument is currently moving above Ichimoku Cloud, thus indicating an ascending tendency. The markets could indicate that the price may test the cloud’s upside border at 1.0155 and then resume moving upwards to reach 1.0530. Another signal in favour of a further uptrend will be a rebound from the descending channel‘s upside border. However, the bullish scenario may no longer be valid if the price breaks the cloud’s downside border and fixes below 1.0005. In this case, the pair may continue falling towards 0.9905. To confirm a further uptrend, the price must break the bearish channels upside border and fix above 1.0335.
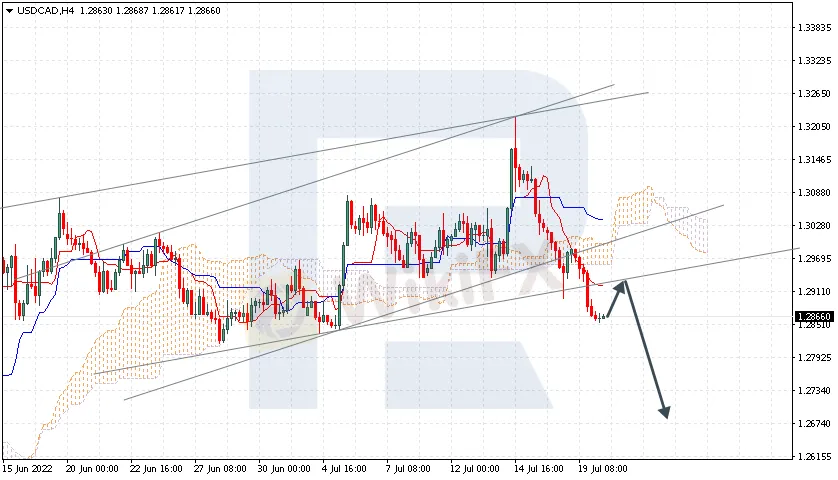
USDCAD, “US Dollar vs Canadian Dollar”
USDCAD is rebounding from the support area. The instrument is currently moving below Ichimoku Cloud, thus indicating a descending tendency. The markets could indicate that the price may test Tenkan-Sen at 1.2910 and then resume moving downwards to reach 1.2675. Another signal in favour of a further downtrend will be a rebound from the rising channel‘s downside border. However, the bearish scenario may no longer be valid if the price breaks the cloud’s upside border and fixes above 1.3105. In this case, the pair may continue growing towards 1.3205.
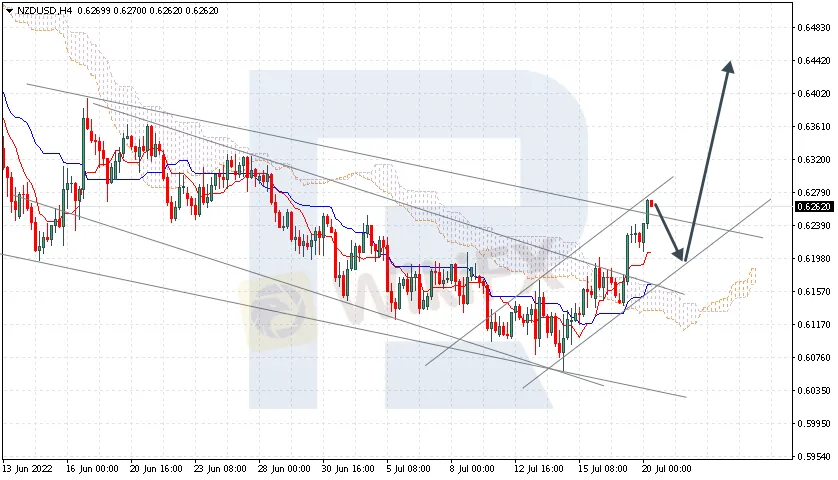
NZDUSD, “New Zealand Dollar vs US Dollar”
NZDUSD is growing within the bullish impulse. The instrument is currently moving above Ichimoku Cloud, thus indicating an ascending tendency. The markets could indicate that the price may test Tenkan-Sen at 0.6195 and then resume moving upwards to reach 0.6445. Another signal in favour of a further uptrend will be a rebound from the descending channel‘s upside border. However, the bullish scenario may no longer be valid if the price breaks the cloud’s downside border and fixes below 0.6095. In this case, the pair may continue falling towards 0.6005.

Read more
KAMA Capital Review: Do Traders Lose Due to Slippage & Inappropriate Liquidation?
Looking to trade through KAMA Capital, a Mauritius-based forex broker? You must read user reviews concerning fund safety with this brokerage entity. The company, which has been around for two-five years, has received some negative reviews recently for its several trading activities. Users have reported these experiences on broker review platforms such as WikiFX. The negative KAMA Capital reviews highlight serious slippage issues, coupled with inappropriate liquidation issues. The article aims to provide a clear picture of these user allegations along with a regulatory overview of the broker. This will help you make an informed trading decision. Read on!
MTRADING User Reputation: A Deep Look into Real Complaints and Warning Signs
When traders look for information about a broker, their biggest worry is always capital safety. The question, "Is MTRADING safe or scam?" gets right to the point. Based on checkable information from worldwide broker regulatory websites, the answer comes with serious warnings. MTRADING operates with major warning signs, especially a status of "No Regulation" and a very low trust score. WikiFX, a third-party checking service, gives the broker an extremely low rating and clearly warns of "High potential risk". This article will break down the proof behind this conclusion. We will look at MTRADING's regulatory status, examine real user complaints recorded on public websites, and check its platform features to give a clear, fact-based view for any potential user.

MTRADING Legitimacy Check: Is This a Fake Broker or a Legitimate Trading Partner?
You're asking 'Is MTRADING legit?' or worried about an 'MTRADING scam', and that's the right question to ask before risking your funds. A deep look into MTRADING's background shows major warning signs that should make you very careful. This isn't a simple yes or no answer; it's a fact-based review of the risks. Our research, using data from independent broker checking websites like WikiFX, shows MTRADING has a very low score, which means there are serious problems. The main worries are about whether it's properly regulated and the troubling number of customer complaints.

Core Prime Withdrawal & Deposit: What You MUST Know Before Funding Your Account
For any trader, understanding how to move funds is extremely important. How you add funds to your account and, more importantly, how you take them out, including the profits earned on the platform, can shape your entire trading experience. You are likely here looking for specific information about Core Prime deposit and Core Prime withdrawal methods. This guide will explain the payment options the broker claims to offer. However, knowing the process is only part of the story. The other, more important part involves understanding the risks and whether the broker can be trusted. A nice-looking website and many payment options mean nothing if your capital is not safe. The main question we need to ask is not just *how* you can withdraw funds, but *if* you can. Can you trust that your funds will be safe and your withdrawal requests will be processed? Let's look at the facts.
WikiFX Broker
Latest News
GLOBAL PRIME Review 2026: Is this Forex Broker Legit or a Scam?
 WikiFX
Why That FCA Regulation Logo Might Not Protect You
WikiFXUS Dollar Sinks as Oil Plunges
WikiFXSTMarket Promotes Trading Education While Client Alleges $3,250 Withdrawal Delay
WikiFXHere's what to expect from Friday's release of the April jobs report
WikiFXMTRADING Legitimacy Check: Is This a Fake Broker or a Legitimate Trading Partner?
WikiFXTrilt Review 2025: Is This Forex Broker Safe?
WikiFX225 People Investigated as Singapore Losses Exceed S$4.8 Million
WikiFXLuxury Villas in Sabah Raided, 28 Foreign Suspects Arrested
WikiFXWhy Smart Beginners Keep Blowing Up Their Forex Accounts
WikiFXRate Calc

