
2026-09-26 03:32
IndustryHow to Identify Selling Pressure
When sellers start becoming more active, the chart usually gives a few clues.
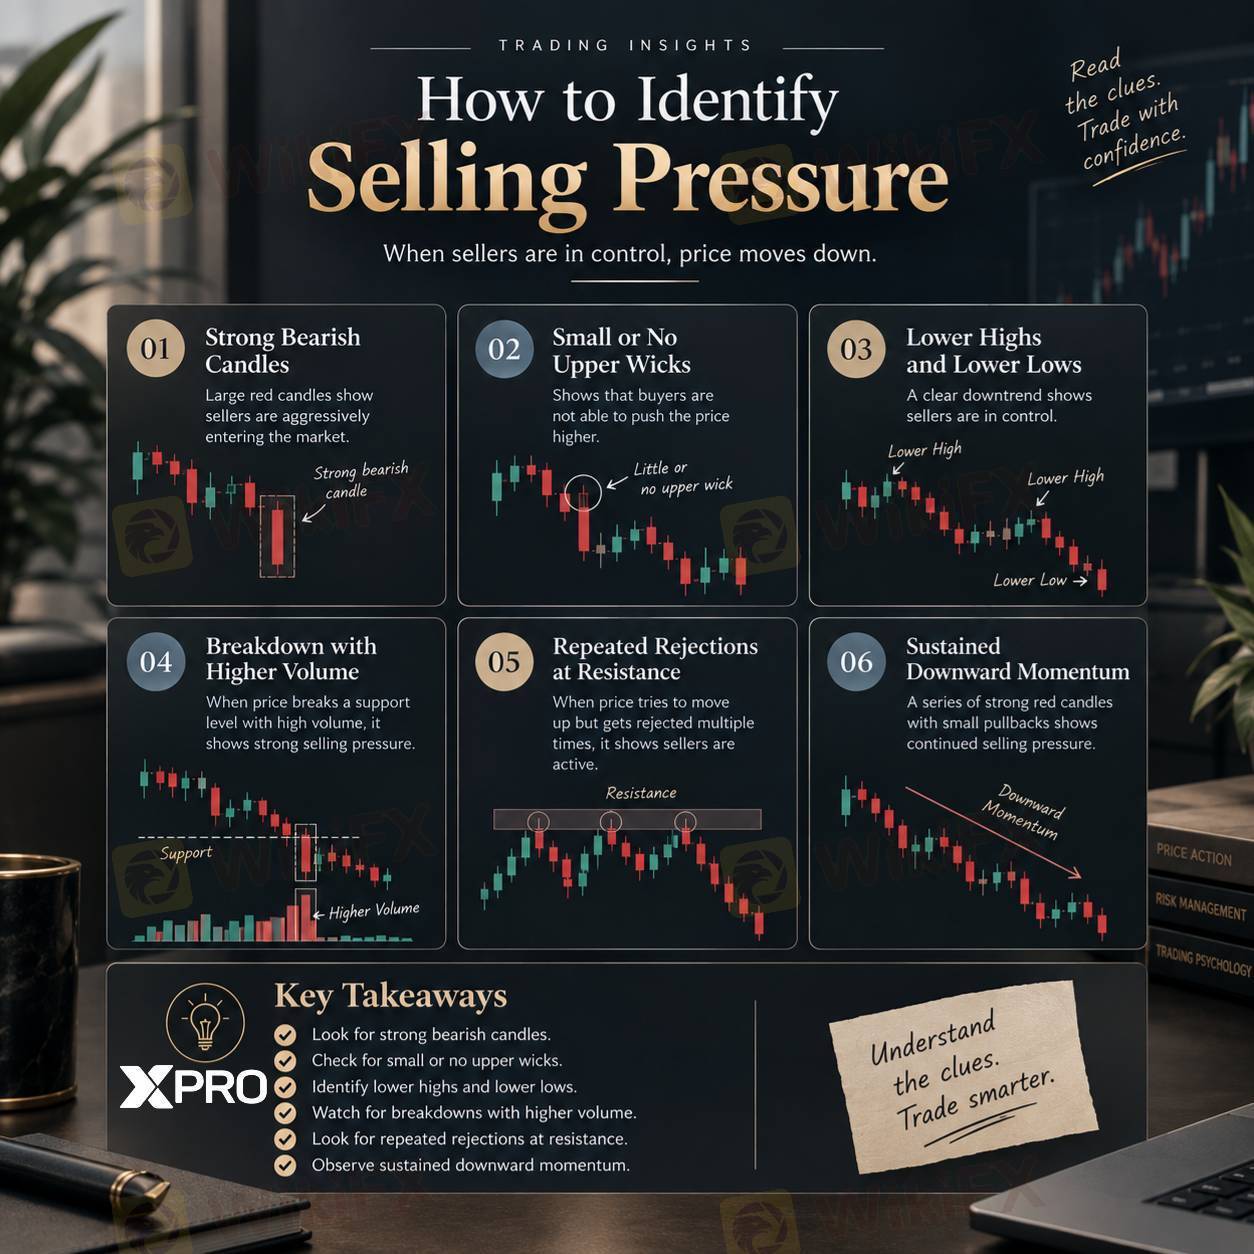
Strong bearish candles, small upper wicks, lower highs and lower lows, repeated rejection at resistance, and breakdowns with higher volume can all point to increasing selling pressure.
But I wouldn’t rely on just one signal. The bigger picture matters. When several of these clues appear together and the downward move continues, the selling pressure becomes easier to recognize.
The goal is simple: read the price action, wait for confirmation, and avoid reacting to every single candle.
Like 0

ThexproLLC
Trader
Hot content
Industry
Event-A comment a day,Keep rewards worthy up to$27
Industry
Nigeria Event Giveaway-Win₦5000 Mobilephone Credit
Industry
Nigeria Event Giveaway-Win ₦2500 MobilePhoneCredit
Industry
South Africa Event-Come&Win 240ZAR Phone Credit
Industry
Nigeria Event-Discuss Forex&Win2500NGN PhoneCredit
Industry
[Nigeria Event]Discuss&win 2500 Naira Phone Credit
Forum category

Platform

Exhibition

Agent

Recruitment

EA

Industry

Market

Index
How to Identify Selling Pressure
United Kingdom | 2026-09-26 03:32When sellers start becoming more active, the chart usually gives a few clues.
Strong bearish candles, small upper wicks, lower highs and lower lows, repeated rejection at resistance, and breakdowns with higher volume can all point to increasing selling pressure.
But I wouldn’t rely on just one signal. The bigger picture matters. When several of these clues appear together and the downward move continues, the selling pressure becomes easier to recognize.
The goal is simple: read the price action, wait for confirmation, and avoid reacting to every single candle.
Like 0
I want to comment, too
Submit
0Comments

There is no comment yet. Make the first one.
Submit
There is no comment yet. Make the first one.