
2026-08-25 16:02
IndustryWhat are Swing Points?
Hey everyone 👋🏻
You’ve probably seen those green and red dots on charts and wondered what they actually mean. Those are swing points, and once you understand them, reading price becomes a lot clearer.
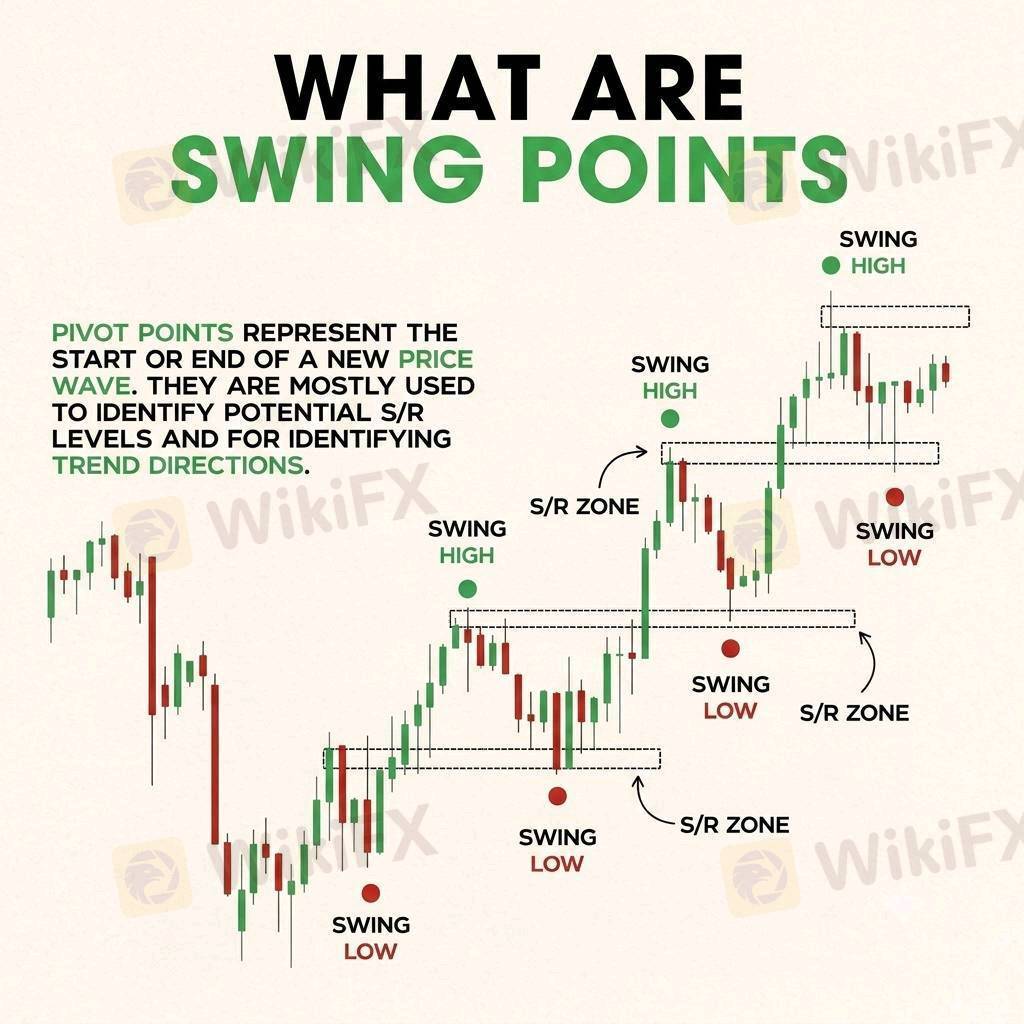
Swing points (also called pivot points) mark the start or end of a price wave. In simple words: A Swing High is a peak where price stopped going up and started turning down.
A Swing Low is a bottom where price stopped falling and started turning up.
Look at the chart in the image. The green dots sit on the local highs, the red dots sit on the local lows. Those dashed boxes around them are Support & Resistance (S/R) zones , areas where price has reacted before and is likely to react again. Why swing points matter?
They help you do two important things:
1.) Spot potential support and resistance levels without guessing.
2.) Identify the overall trend.
Higher swing highs + higher swing lows = uptrend
Lower swing highs + lower swing lows = downtrend
That’s it. No complicated formulas. Just watching where price makes clear turns. When price comes back to a previous swing high or swing low zone, many traders watch closely for reactions , bounce, break, or rejection. These zones often act as decision areas.
Quick tip: Don’t force every small wiggle into a swing point. Focus on the clearer, more obvious ones that stand out on the chart. Quality over quantity. Next time you open your chart, mark a few recent swing highs and lows. You’ll start seeing structure instead of just candles.
Like 0

ThexproLLC
Trader
Hot content
Industry
Event-A comment a day,Keep rewards worthy up to$27
Industry
Nigeria Event Giveaway-Win₦5000 Mobilephone Credit
Industry
Nigeria Event Giveaway-Win ₦2500 MobilePhoneCredit
Industry
South Africa Event-Come&Win 240ZAR Phone Credit
Industry
Nigeria Event-Discuss Forex&Win2500NGN PhoneCredit
Industry
[Nigeria Event]Discuss&win 2500 Naira Phone Credit
Forum category

Platform

Exhibition

Agent

Recruitment

EA

Industry

Market

Index
What are Swing Points?
United Kingdom | 2026-08-25 16:02Hey everyone 👋🏻
You’ve probably seen those green and red dots on charts and wondered what they actually mean. Those are swing points, and once you understand them, reading price becomes a lot clearer.
Swing points (also called pivot points) mark the start or end of a price wave. In simple words: A Swing High is a peak where price stopped going up and started turning down.
A Swing Low is a bottom where price stopped falling and started turning up.
Look at the chart in the image. The green dots sit on the local highs, the red dots sit on the local lows. Those dashed boxes around them are Support & Resistance (S/R) zones , areas where price has reacted before and is likely to react again. Why swing points matter?
They help you do two important things:
1.) Spot potential support and resistance levels without guessing.
2.) Identify the overall trend.
Higher swing highs + higher swing lows = uptrend
Lower swing highs + lower swing lows = downtrend
That’s it. No complicated formulas. Just watching where price makes clear turns. When price comes back to a previous swing high or swing low zone, many traders watch closely for reactions , bounce, break, or rejection. These zones often act as decision areas.
Quick tip: Don’t force every small wiggle into a swing point. Focus on the clearer, more obvious ones that stand out on the chart. Quality over quantity. Next time you open your chart, mark a few recent swing highs and lows. You’ll start seeing structure instead of just candles.
Like 0
I want to comment, too
Submit
0Comments

There is no comment yet. Make the first one.
Submit
There is no comment yet. Make the first one.