
2026-08-22 15:57
IndustryUnderstanding Liquidy Pools
Ever feel like the market is watching your exact stop-loss level? You enter a trade, price spikes just enough to kick you out, and then immediately shoots off in the exact direction you originally predicted.
You aren't crazy—you're just getting caught in a liquidity grab.
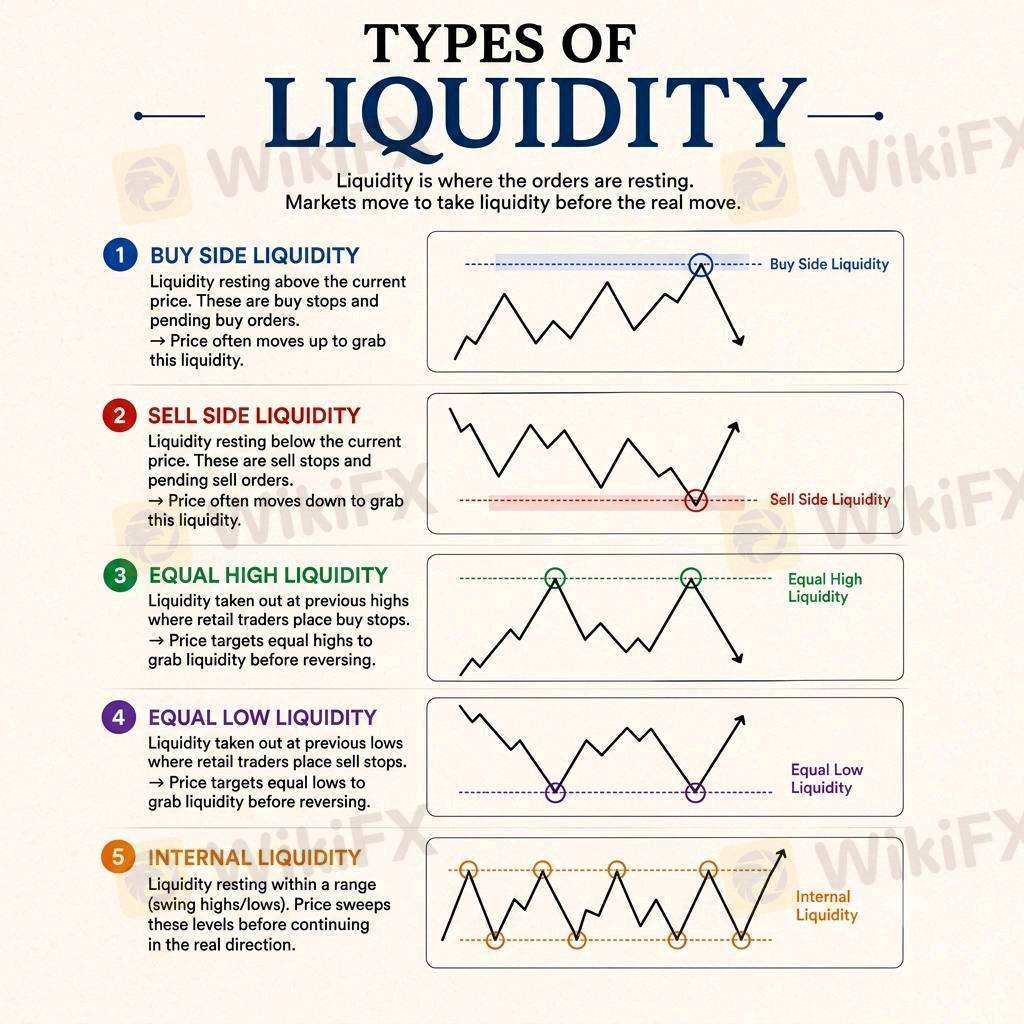
Big institutional traders (the smart money) need massive amounts of orders to fill their positions. They target areas on the chart where stop-losses and pending orders gather. Check out the graphic above for a quick breakdown of where that liquidity sits:
Buy Side Liquidity (BSL): Resting above current prices. Think buy stops and stop-losses for short positions.
Price often sweeps up here before dropping.
Sell Side Liquidity (SSL): Resting below current prices. These are sell stops and stop-losses for long trades. Price drops to grab these before rallying.
Equal Highs & Equal Lows: Double tops or bottoms look like clean resistance or support to retail traders. In reality, they are giant magnets for price sweeps.
Internal Liquidity: Minor swing highs and lows sitting inside a larger trend range. The market sweeps these internal levels to fuel the true macro move.
Stop treating previous highs and lows purely as support and resistance. Instead, view them as liquidity pools. Before you jump into a trade, ask yourself: Has the market already taken out liquidity, or am I about to become the liquidity?
Like 0

ThexproLLC
Trader
Hot content
Industry
Event-A comment a day,Keep rewards worthy up to$27
Industry
Nigeria Event Giveaway-Win₦5000 Mobilephone Credit
Industry
Nigeria Event Giveaway-Win ₦2500 MobilePhoneCredit
Industry
South Africa Event-Come&Win 240ZAR Phone Credit
Industry
Nigeria Event-Discuss Forex&Win2500NGN PhoneCredit
Industry
[Nigeria Event]Discuss&win 2500 Naira Phone Credit
Forum category

Platform

Exhibition

Agent

Recruitment

EA

Industry

Market

Index
Understanding Liquidy Pools
United Kingdom | 2026-08-22 15:57Ever feel like the market is watching your exact stop-loss level? You enter a trade, price spikes just enough to kick you out, and then immediately shoots off in the exact direction you originally predicted.
You aren't crazy—you're just getting caught in a liquidity grab.
Big institutional traders (the smart money) need massive amounts of orders to fill their positions. They target areas on the chart where stop-losses and pending orders gather. Check out the graphic above for a quick breakdown of where that liquidity sits:
Buy Side Liquidity (BSL): Resting above current prices. Think buy stops and stop-losses for short positions.
Price often sweeps up here before dropping.
Sell Side Liquidity (SSL): Resting below current prices. These are sell stops and stop-losses for long trades. Price drops to grab these before rallying.
Equal Highs & Equal Lows: Double tops or bottoms look like clean resistance or support to retail traders. In reality, they are giant magnets for price sweeps.
Internal Liquidity: Minor swing highs and lows sitting inside a larger trend range. The market sweeps these internal levels to fuel the true macro move.
Stop treating previous highs and lows purely as support and resistance. Instead, view them as liquidity pools. Before you jump into a trade, ask yourself: Has the market already taken out liquidity, or am I about to become the liquidity?
Like 0
I want to comment, too
Submit
0Comments

There is no comment yet. Make the first one.
Submit
There is no comment yet. Make the first one.