
2026-07-30 17:25
IndustryBullish Candlestick Patterns Guide
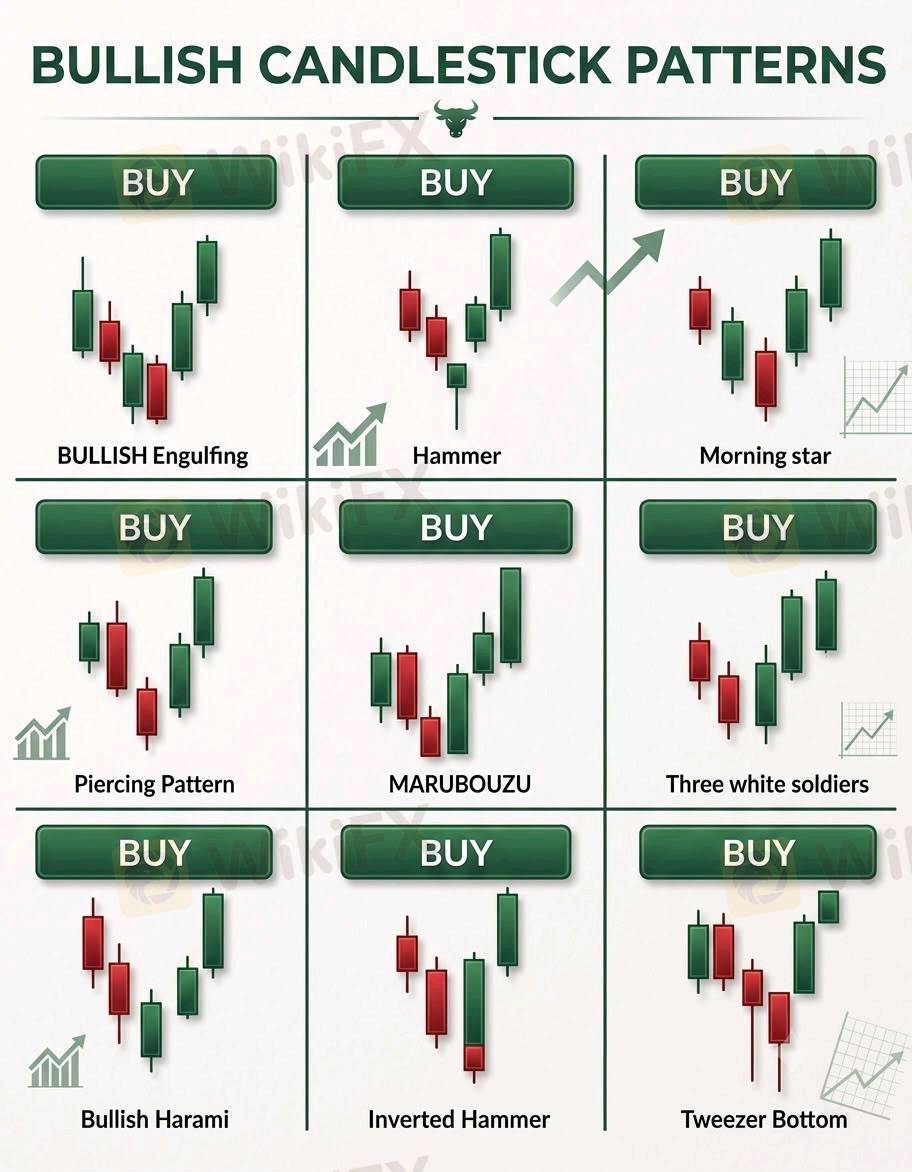
1. Bullish EngulfingA two-candle reversal pattern. A small red candle is followed by a larger green candle that completely engulfs the previous red candle’s body. It signals a strong shift from selling to buying pressure.2. HammerA single-candle pattern with a small body at the top and a long lower shadow (wick). It appears at the bottom of a downtrend and indicates that sellers were overpowered by buyers, suggesting a potential reversal.3. Morning StarA three-candle reversal pattern. It starts with a long red candle, followed by a small-bodied candle (gap down), and ends with a strong green candle that closes well into the first candle’s body. Signals the end of a downtrend.4. Piercing PatternA two-candle pattern. A long red candle is followed by a green candle that opens lower but closes above the midpoint of the previous red candle’s body. Indicates strong buying interest after a decline.5. Bullish MarubozuA long green candle with little to no upper or lower shadows. It shows strong, sustained buying throughout the session, reflecting powerful bullish momentum.6. Three White SoldiersA three-candle continuation/reversal pattern consisting of three consecutive long green candles with higher closes. It signals strong buying pressure and a robust uptrend.7. Bullish HaramiA two-candle pattern where a large red candle is followed by a smaller green candle completely inside the previous candle’s range. It suggests the downtrend is losing strength and a reversal may be near.8. Inverted HammerA single-candle pattern with a small body at the bottom and a long upper shadow. Appears after a downtrend and indicates that buyers attempted to push prices higher, often preceding a bullish reversal.9. Tweezer BottomA two-candle pattern where two candles have nearly identical long lower shadows (wicks) at the same price level. It shows strong support at that price and potential reversal to the upside.
Like 0

ThexproLLC
Trader
Hot content
Industry
Event-A comment a day,Keep rewards worthy up to$27
Industry
Nigeria Event Giveaway-Win₦5000 Mobilephone Credit
Industry
Nigeria Event Giveaway-Win ₦2500 MobilePhoneCredit
Industry
South Africa Event-Come&Win 240ZAR Phone Credit
Industry
Nigeria Event-Discuss Forex&Win2500NGN PhoneCredit
Industry
[Nigeria Event]Discuss&win 2500 Naira Phone Credit
Forum category

Platform

Exhibition

Agent

Recruitment

EA

Industry

Market

Index
Bullish Candlestick Patterns Guide
United Kingdom | 2026-07-30 17:251. Bullish EngulfingA two-candle reversal pattern. A small red candle is followed by a larger green candle that completely engulfs the previous red candle’s body. It signals a strong shift from selling to buying pressure.2. HammerA single-candle pattern with a small body at the top and a long lower shadow (wick). It appears at the bottom of a downtrend and indicates that sellers were overpowered by buyers, suggesting a potential reversal.3. Morning StarA three-candle reversal pattern. It starts with a long red candle, followed by a small-bodied candle (gap down), and ends with a strong green candle that closes well into the first candle’s body. Signals the end of a downtrend.4. Piercing PatternA two-candle pattern. A long red candle is followed by a green candle that opens lower but closes above the midpoint of the previous red candle’s body. Indicates strong buying interest after a decline.5. Bullish MarubozuA long green candle with little to no upper or lower shadows. It shows strong, sustained buying throughout the session, reflecting powerful bullish momentum.6. Three White SoldiersA three-candle continuation/reversal pattern consisting of three consecutive long green candles with higher closes. It signals strong buying pressure and a robust uptrend.7. Bullish HaramiA two-candle pattern where a large red candle is followed by a smaller green candle completely inside the previous candle’s range. It suggests the downtrend is losing strength and a reversal may be near.8. Inverted HammerA single-candle pattern with a small body at the bottom and a long upper shadow. Appears after a downtrend and indicates that buyers attempted to push prices higher, often preceding a bullish reversal.9. Tweezer BottomA two-candle pattern where two candles have nearly identical long lower shadows (wicks) at the same price level. It shows strong support at that price and potential reversal to the upside.
Like 0
I want to comment, too
Submit
0Comments

There is no comment yet. Make the first one.
Submit
There is no comment yet. Make the first one.