2024-11-09 04:08
IndustryGold technical outlook
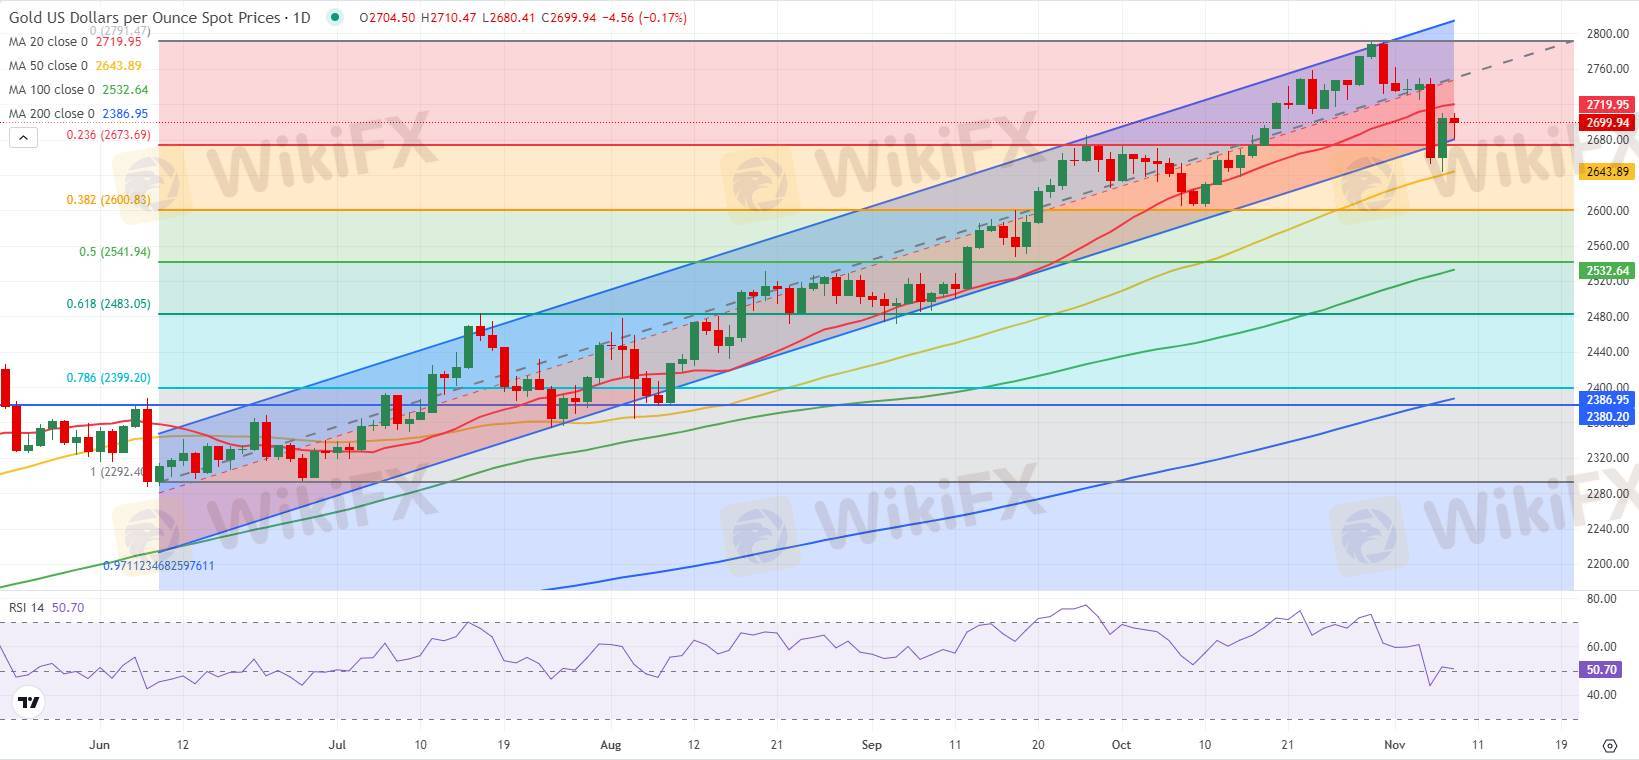
After dropping below the lower limit of the ascending regression channel coming from June, Gold found support and returned within this channel. The Relative Strength Index (RSI) indicator on the daily chart, however, failed to push higher after recovering to 50, reflecting buyers’ hesitancy.
On the downside, key support area seems to have formed at $2,680-$2,675, where the Fibonacci 23.6% retracement of the uptrend and the lower limit of the ascending channel meet, ahead of the 50-day Simple Moving Average (SMA) at $2,640. A daily close below this support could open the door for another leg lower toward $2,600.
Looking north, the first resistance could be spotted at $2,720 (20-day SMA). In case XAU/USD flips that level into support, technical buyers could take action. In this scenario, $2,760 (mid-point of the ascending channel) could be seen as the next hurdle before $2,790 (record-high).
Like 0

FX1802677189
Trader
Hot content
Industry
Event-A comment a day,Keep rewards worthy up to$27
Industry
Nigeria Event Giveaway-Win₦5000 Mobilephone Credit
Industry
Nigeria Event Giveaway-Win ₦2500 MobilePhoneCredit
Industry
South Africa Event-Come&Win 240ZAR Phone Credit
Industry
Nigeria Event-Discuss Forex&Win2500NGN PhoneCredit
Industry
[Nigeria Event]Discuss&win 2500 Naira Phone Credit
Forum category

Platform

Exhibition

Agent

Recruitment

EA

Industry

Market

Index
Gold technical outlook
 | 2024-11-09 04:08
After dropping below the lower limit of the ascending regression channel coming from June, Gold found support and returned within this channel. The Relative Strength Index (RSI) indicator on the daily chart, however, failed to push higher after recovering to 50, reflecting buyers’ hesitancy.
On the downside, key support area seems to have formed at $2,680-$2,675, where the Fibonacci 23.6% retracement of the uptrend and the lower limit of the ascending channel meet, ahead of the 50-day Simple Moving Average (SMA) at $2,640. A daily close below this support could open the door for another leg lower toward $2,600.
Looking north, the first resistance could be spotted at $2,720 (20-day SMA). In case XAU/USD flips that level into support, technical buyers could take action. In this scenario, $2,760 (mid-point of the ascending channel) could be seen as the next hurdle before $2,790 (record-high).
Like 0
I want to comment, too
Submit
0Comments

There is no comment yet. Make the first one.

Submit
There is no comment yet. Make the first one.