EUR/USD and EUR/JPY Outlook: Euro Strength Puts Breakouts in Focus

Abstract:EUR/USD and EUR/JPY have both broken higher as the euro gains support from improved market sentiment and easing energy pressure. Key resistance and support levels are now coming into focus.
The euro has regained momentum across major pairs, with both EUR/USD and EUR/JPY moving through important technical zones. A softer risk backdrop and reduced pressure from energy markets have helped support the single currency, allowing recent bullish structures to develop further.
While the initial move was driven by a broader improvement in market tone, the charts now matter more than the headline that triggered the reaction. In both pairs, price has pushed out of consolidation patterns and is now testing levels that could decide whether this becomes a short-term breakout or just a brief burst of strength.
EUR/USD moves out of compression
EUR/USD had already been tightening for weeks inside a narrowing formation, and that period of compression has now given way to an upside break. The pair is moving into a technically important zone where several medium-term moving averages are clustered together.
That area, around 1.1683, stands out because it combines the 50-day, 100-day, and 200-day moving averages with a level that has repeatedly acted as support and resistance in previous trading phases. When several technical markers line up in one place, the market tends to treat it as a serious test rather than just another price level.
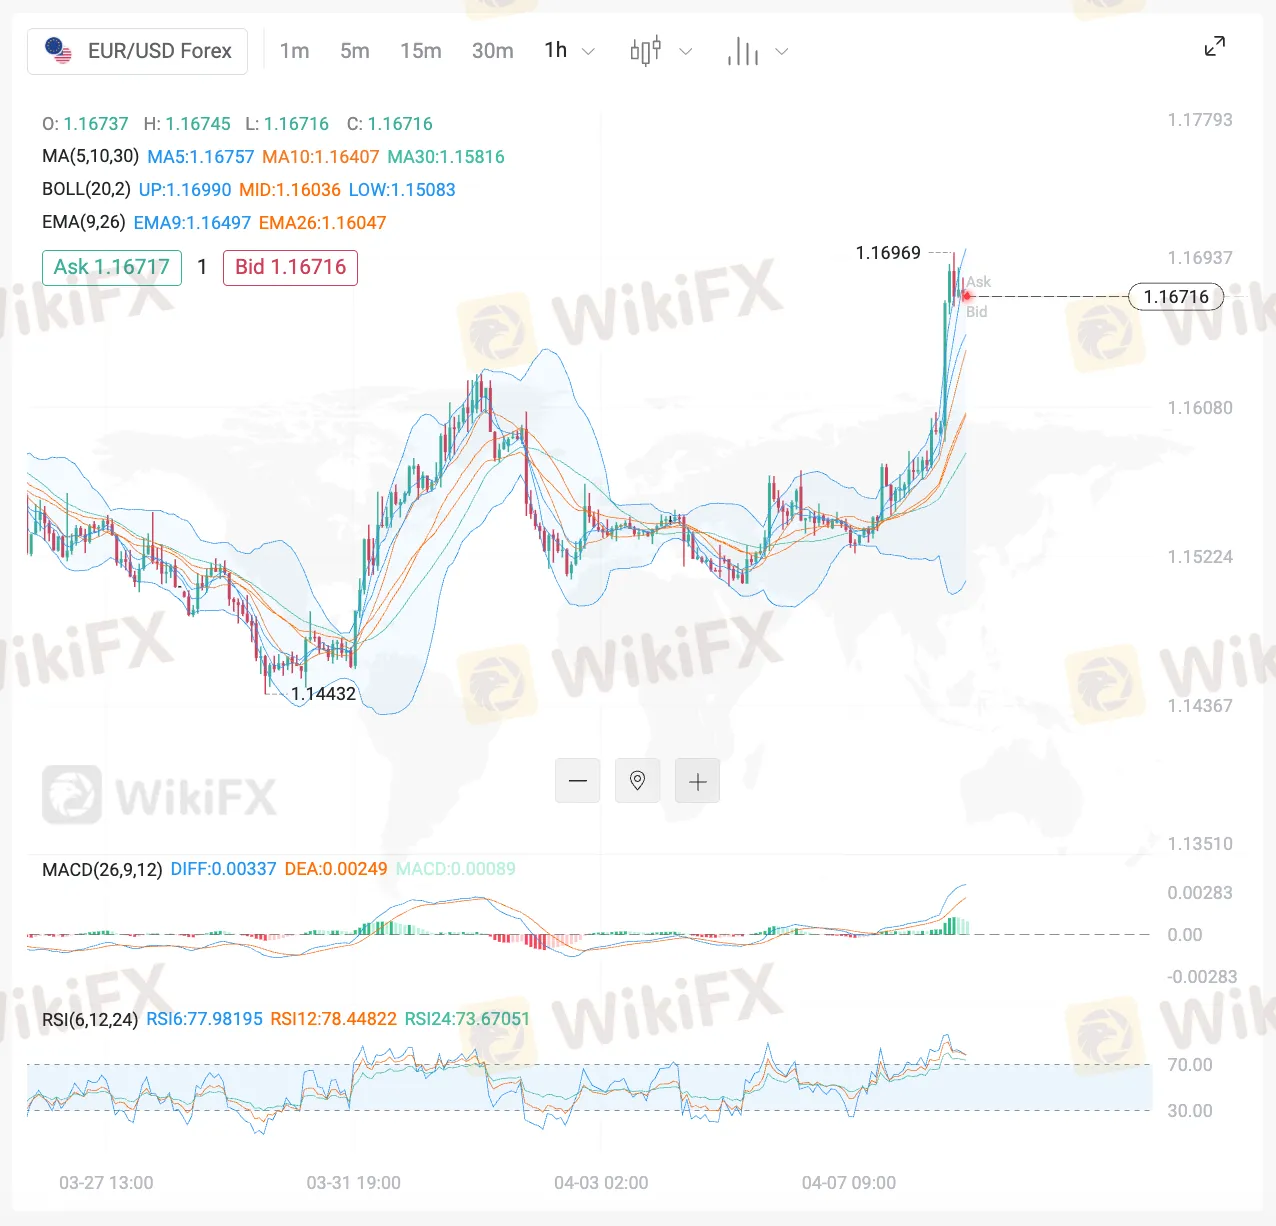
If buyers manage to push clearly through that zone, attention may shift toward 1.1768 and then 1.1837, both of which have previously acted as turning points on the chart.
If the pair struggles to extend the move, the old upper boundary of the broken triangle may begin to act as support. In that case, the focus would shift from breakout continuation to whether the pair can hold above the area it has just reclaimed.
The breakout still needs confirmation
Although the move in EUR/USD has improved the short-term picture, it is not yet a fully resolved trend. Momentum indicators remain relatively balanced, which means price action itself is still the more important guide.
That leaves the pair in a technically constructive position, but one that still requires confirmation from the next leg. A clean hold above former resistance would strengthen the breakout case. A rejection near the moving-average cluster would make the structure less convincing.
EUR/JPY shows a cleaner bullish break
EUR/JPY has produced the stronger chart signal of the two. The pair has broken above its ascending triangle and moved through resistance around 184.50, while also clearing the previous swing high near 184.80.
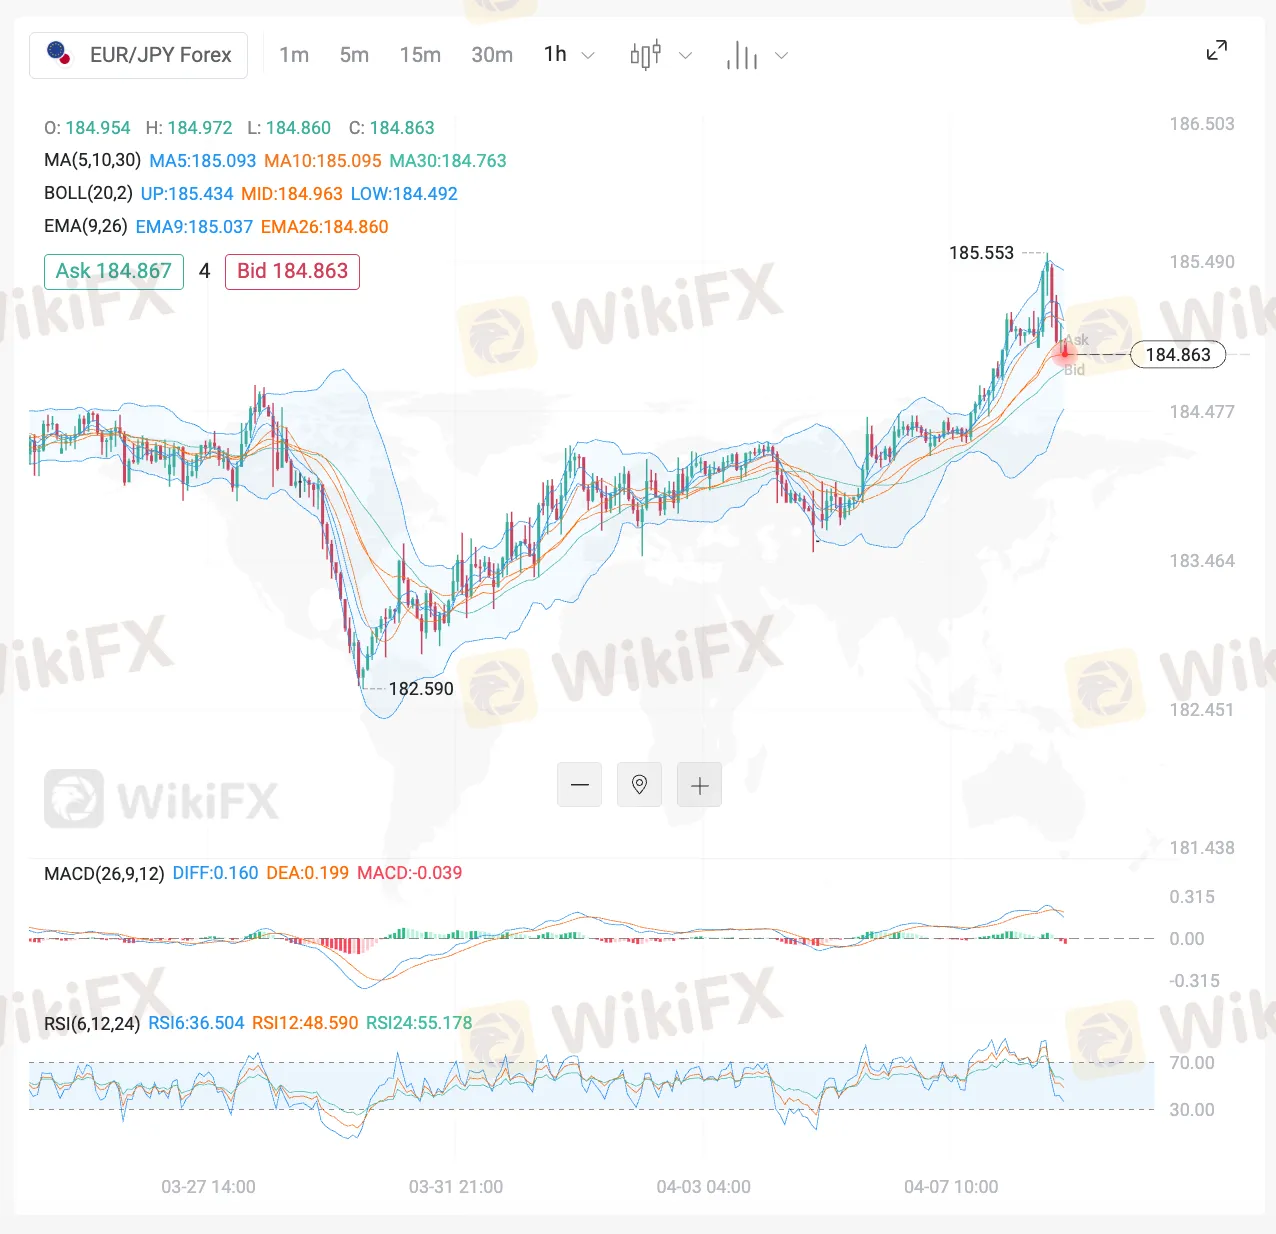
That breakout matters because it removes a ceiling that had held price in place and turns the old barrier into a possible support zone. When a market clears a well-defined cap and then holds above it, the structure becomes easier to read.
In this case, the euros strength has combined with a softer tone in the yen to create a cleaner upside path than what is currently visible on EUR/USD.
Momentum now favors the upside
The technical backdrop on EUR/JPY looks more supportive from a momentum standpoint as well. Both RSI (14) and MACD are aligned in a way that favors a bullish interpretation, and the pair is trading above key moving averages.
That combination tends to keep the focus on buying pullbacks or following breakouts rather than looking immediately for reversal signals. It also matters that the prior sequence of lower highs has now been broken, because that removes one of the clearer bearish features from the earlier structure.
The next upside level to watch is the February 9 high at 186.23, followed by the 2026 high at 186.90.
Why the euro is outperforming here
The recent move is not just about one chart pattern. The euro has been supported by a broader shift in sentiment, especially as pressure linked to energy costs has eased. That has given the currency more room to strengthen, particularly against counterparts that are more sensitive to changes in defensive positioning.
That contrast is especially visible in EUR/JPY, where the euro has outperformed more clearly than against the dollar.
Final view
The euro has moved back into a stronger position, and both EUR/USD and EUR/JPY are reflecting that change on the chart.
EUR/USD has broken out, but is now facing a dense resistance area that still needs to be cleared decisively. EUR/JPY looks cleaner, with a more established breakout and stronger momentum support behind it.
For now, the euro remains on firmer footing. The next question is whether these breakouts can hold above former resistance and turn recent strength into something more sustained.

Read more

One Lot Size Mistake Can Cost You Thousands—Here's Where the 1% Rule Helps
Switched from one trading strategy to another but could not avert heavy losses? Wondering what went wrong despite your market analysis being spot on? It may not be a strategic issue then. It may just be that you chose the wrong lot size. Yes, a single oversized position can get your account exposed to far greater risks than you may imagine. You may be moved by the impressive profits with increasing lot sizes. But by doing so, you also invite a proportionate rise in losses. This is where you need to apply the essential 1% risk management principle. This rule helps you assess how much you can afford to lose if a trade does not go as planned.

Your Backtesting Results Mean Nothing If You Ignore This One Live Trading Reality
Backtesting remains one of the primary skills forex traders learn. By implementing a trading strategy based on historical currency pair price information, traders can view their past performance. The strategy leading to consistent profits during backtesting can raise confidence and lay a structured approach to the forex market. However, the path is not as simple as it may sound. Several traders tend to meet a harsh reality when transitioning to live trading. The strategy that seemed almost flawless on historical charts suddenly fails to deliver the results it did before. The sudden difference may not necessarily be because of a poor strategy. Rather, it indicates limitations concerning backtesting and several factors that play their part in a live market where conditions change frequently. It is thus important to understand these differences so that you can set realistic expectations and work on to achieve consistent success.

Can AI Really Improve Forex Trading? The Benefits, Risks and Hidden Limitations
We are living in the age of artificial intelligence, where everything including financial matters such as forex are rapidly influenced by this phenomenon. AI-powered tools are here to identify numerous trading opportunities and analyze thousands of data, all in seconds, becoming the preferred option for both retail and institutional traders. Regardless of its immense benefits, traders often question - Whether the AI can truly transform their forex trading experience or is it just like another technology offering scope for unrealistic expectations? While the AI can ensure faster trading and more informed decisions, it is never a sure shot way to profits. As a trader, you need to understand both the strengths and limitations of AI when it comes to generating real wealth.

Copy Trading Gone Wrong? The Mistakes That Could Wipe Out Your Entire Trading Account
We all love trading geniuses and their strategies that earn them profits season after season. And we also love following them to make our investment journey seamless. Copy trading is one such tactic that beginners employ to enter the forex market. What do most of them usually do? They pick an experienced investor from the list and let the platform replicate every trade automatically. The fact that experienced traders continually earn profits, the feeling of copying their trades remains intense. However, the uncertain forex landscape can bite you hard by simply copying trades and not focusing on technical analysis and the charts during the day. Beginners can have a set of preconceived notions that can potentially open the gate for losses. In this article, we have highlighted such mistakes traders should avoid.
WikiFX Broker
Latest News
Ipoh Businessman Loses RM1.25 Million in Crypto Group that Promised High Returns
WikiFXActivTrades Review 2026: Regulation, Complaints, and Withdrawal Risks
WikiFXAligning H4, H1, and M15 Charts for Clearer Intraday Forex Trades
WikiFXBuilding a Forex Strategy: What Beginners Get Wrong About Risk and Chart Patterns
WikiFXRisk Management for Beginners: How Margin and Stop-Losses Prevent Account Blowouts
WikiFXWikiEXPO Hong Kong 2026 Set to Open, Bringing Together Global Leaders in Fintech and Digital Finance
WikiFXAIPrime Showcases AI-Driven Trading Innovation at WikiEXPO Hong Kong
WikiFXU.S. Inflation Cools on Paper, But the Fire Still Burns
WikiFXEMAR MARKETS Review : FSCA Regulation, Complaints, and High-Leverage Risks
WikiFXFBS Review: Regulation, Complaints, and Withdrawal Risk Signals
WikiFXRate Calc

