A Trader's Complete Guide to Measuring Risk

Abstract:In this passage, you will learn what is maximum drawdown forex means for traders discover how to calculate MDD, measure trading risk, and protect your account from worst-case losses.
Every trader knows this feeling: watching your money disappear as a trade goes wrong. Your stomach drops. Your heart races. This happens to everyone who trades. The real question isn't if it will happen to you. It's how you measure and handle it when it does.

This brings us to something every trader must understand: what is drawdown in forex? Simply put, a drawdown is when your account balance drops from its highest point. But there's an even more important concept you need to know: Maximum Drawdown.
Maximum Drawdown (MDD) shows you the worst loss you could have faced. It's the biggest drop from peak to bottom in your trading history. Think of it as your worst-case scenario. This guide will explain what is maximum drawdown forex means, how to calculate it, and how to use it to become a better trader.
Core Drawdown Concepts
Before diving into Maximum Drawdown, let's build a solid foundation. Many traders confuse regular drawdowns with Maximum Drawdown. This mistake can lead to poor risk management decisions.
A Simple Analogy
Picture your trading journey like climbing a mountain. You start at the bottom with $10,000. You climb up to a viewpoint at $12,000. To reach the next peak, you might need to go down into a valley at $11,000. That drop from $12,000 to $11,000 is a drawdown.

Here's the key point: a drawdown isn't losing your original money. It's dropping from your highest point so far. This distinction matters when we explore what is drawdown in forex.
Defining Maximum Drawdown
Maximum Drawdown takes this idea further. It finds the single worst drop in your entire trading journey. MDD measures the largest loss from your highest point to your lowest point before you hit a new high.
This number looks backward. It tells you the worst historical loss your strategy has suffered. It shows the maximum pain you had to endure to stick with your system.
The MDD Formula
Calculating Maximum Drawdown as a percentage is straightforward:
MDD % = [(Trough Value - Peak Value) / Peak Value] * 100
- Peak Value: The highest point your account has reached
- Trough Value: The lowest point after that peak, before hitting a new high
A Practical Example
Let's see this in action with real numbers. The table below tracks account balance, peaks, and drawdowns.
| Period | Account Equity | Peak So Far | Drawdown from Peak |
| 1 | $10,000 | $10,000 | $0 (0%) |
| 2 | $12,000 | $12,000 | $0 (0%) |
| 3 | $11,000 | $12,000 | -$1,000 (-8.3%) |
| 4 | $13,500 | $13,500 | $0 (0%) |
| 5 | $12,500 | $13,500 | -$1,000 (-7.4%) |
| 6 | $11,500 | $13,500 | -$2,000 (-14.8%) |
| 7 | $14,000 | $14,000 | $0 (0%) |
In this example, the account peaks at $13,500 in Period 4. Then it drops to $11,500 in Period 6. This $2,000 drop is the Maximum Drawdown.
Using our formula: MDD % = [($11,500 - $13,500) / $13,500] * 100 = -14.8%
The Maximum Drawdown for this trading history is 14.8%.
Why MDD is a Critical Metric
While many traders chase profits, smart traders focus on risk. Maximum Drawdown is arguably the most important risk metric. It goes beyond theory and shows real-world experience.
A True Measure of Risk
Some metrics measure how much your returns bounce around. That's useful, but it doesn't show the full picture. MDD measures the worst-case scenario that actually happened. It shows real, tangible loss. This isn't theoretical. It's the actual financial and emotional pain you'd face following a strategy through its worst period.
Setting Realistic Expectations
Knowing your strategy's historical MDD prepares you mentally. If your testing shows a 20% MDD, you won't panic during a 12% drawdown. You'll understand it's within normal limits for your strategy. This knowledge prevents the fatal mistake of abandoning a good strategy during a bad streak.
The Psychological Impact
Being in a deep drawdown is one of trading's biggest challenges. It creates a dangerous emotional cycle:
- Doubt: “Is my strategy broken?”
- Fear: “I'm going to lose everything.”
- Greed: “I need to double my trade size to win it back fast.”
This is where traders break their rules and blow up accounts. MDD helps you prepare mentally. Knowing the potential depth of drawdowns lets you practice your response. You can accept it as part of trading, building the mental strength needed to trade without emotion.
A Key Strategy Benchmark
Imagine comparing two trading systems:
- Strategy A: 20% Average Annual Return, 30% Maximum Drawdown
- Strategy B: 18% Average Annual Return, 10% Maximum Drawdown
New traders might pick Strategy A for its higher return. Experienced traders would choose Strategy B. Why? It achieves strong returns with much less risk. Surviving a 10% drawdown is very different from enduring a 30% one. Lower MDD means a more stable strategy, which is more valuable long-term than slightly higher but riskier returns.
Calculating and Interpreting MDD
Understanding MDD is step one. Step two is learning how to find this metric for your own trading and interpret what it means.
Finding MDD in Platforms
Most modern trading platforms calculate MDD for you.
- MetaTrader 4/5 (MT4/MT5): Go to “Account History,” right-click, and select “Save as Detailed Report.” This creates an HTML file. Look for “Maximal Drawdown” showing both dollar amount and percentage.
- TradingView: When you run a strategy backtest, the “Performance Summary” shows “Max Drawdown” prominently.
- Third-Party Analytics: Services like MyFxBook or FX Blue link to your account and track your MDD in real-time with detailed dashboards.
What is a Good MDD?
There's no single “good” number. An acceptable MDD depends on your trading strategy, potential returns, and risk tolerance. A scalper targeting small profits will have a different MDD profile than a long-term trader.
Here are some general ranges for different trading styles:
| Trading Style | Typical Return Profile | Acceptable MDD Range | Rationale |
| Scalping | Low per trade, high frequency | 5% - 10% | Relies on high win rates. Large drawdowns can wipe out hundreds of small wins. |
| Day Trading | Moderate per trade | 10% - 20% | Balances capturing daily moves with closing positions to avoid overnight risk. |
| Swing Trading | High per trade, holds for days/weeks | 15% - 25% | Must withstand market noise to capture larger, multi-day trends. |
| Position Trading | Very high per trade, holds for months | 20% - 35%+ | Must endure major market cycles and corrections for long-term gains. |
Introducing the Calmar Ratio
The Calmar Ratio connects MDD directly to performance. It measures risk-adjusted returns.
Formula: Calmar Ratio = Annual Return / Maximum Drawdown
This tells you how much annual return your strategy generates for each unit of maximum risk. A strategy with 20% annual return and 10% MDD has a Calmar Ratio of 2.0. A strategy with 30% return and 30% MDD has a Calmar Ratio of 1.0. Higher Calmar Ratios indicate better risk-adjusted performance.
Integrating MDD into Strategy
Knowing your MDD is just the beginning. Professional traders turn it into an active risk management tool. This separates amateurs from pros.
Calibrate Position Sizing
Your historical MDD is crucial for determining position size. If your testing shows a 25% MDD, ask yourself: “On my $10,000 account, could I handle a $2,500 drop from a peak?”
Use this calculation: Potential Loss = Account Size × Historical MDD %
If the resulting dollar amount makes you uncomfortable, your position size is too large. Reduce your risk per trade until the potential MDD falls within your comfort zone.
The Drawdown Threshold Rule
This is a proactive technique used by professional traders. It's a pre-planned circuit breaker to protect your money and psychology. The rule: “If my current drawdown reaches a certain percentage of my historical MDD, I will take specific action.”
A common threshold is 50% to 75% of historical MDD. For a strategy with 20% historical MDD, this trigger might be 10%-15% current drawdown. The actions are decided when you're calm, not during a losing streak:
- Action 1: Pause Live Trading. Stop all new trades for a set period (like one week). This creates cooling-off time to detach emotionally and analyze markets objectively.
- Action 2: Reduce Position Size. When you resume, cut your trade size by 50%. Continue with reduced size until your account makes a new peak.
- Action 3: Full Strategy Review. Analyze recent losing trades. Was it bad luck, or has the market changed? Is your trending strategy struggling in a ranging market?
Backtesting for Drawdowns
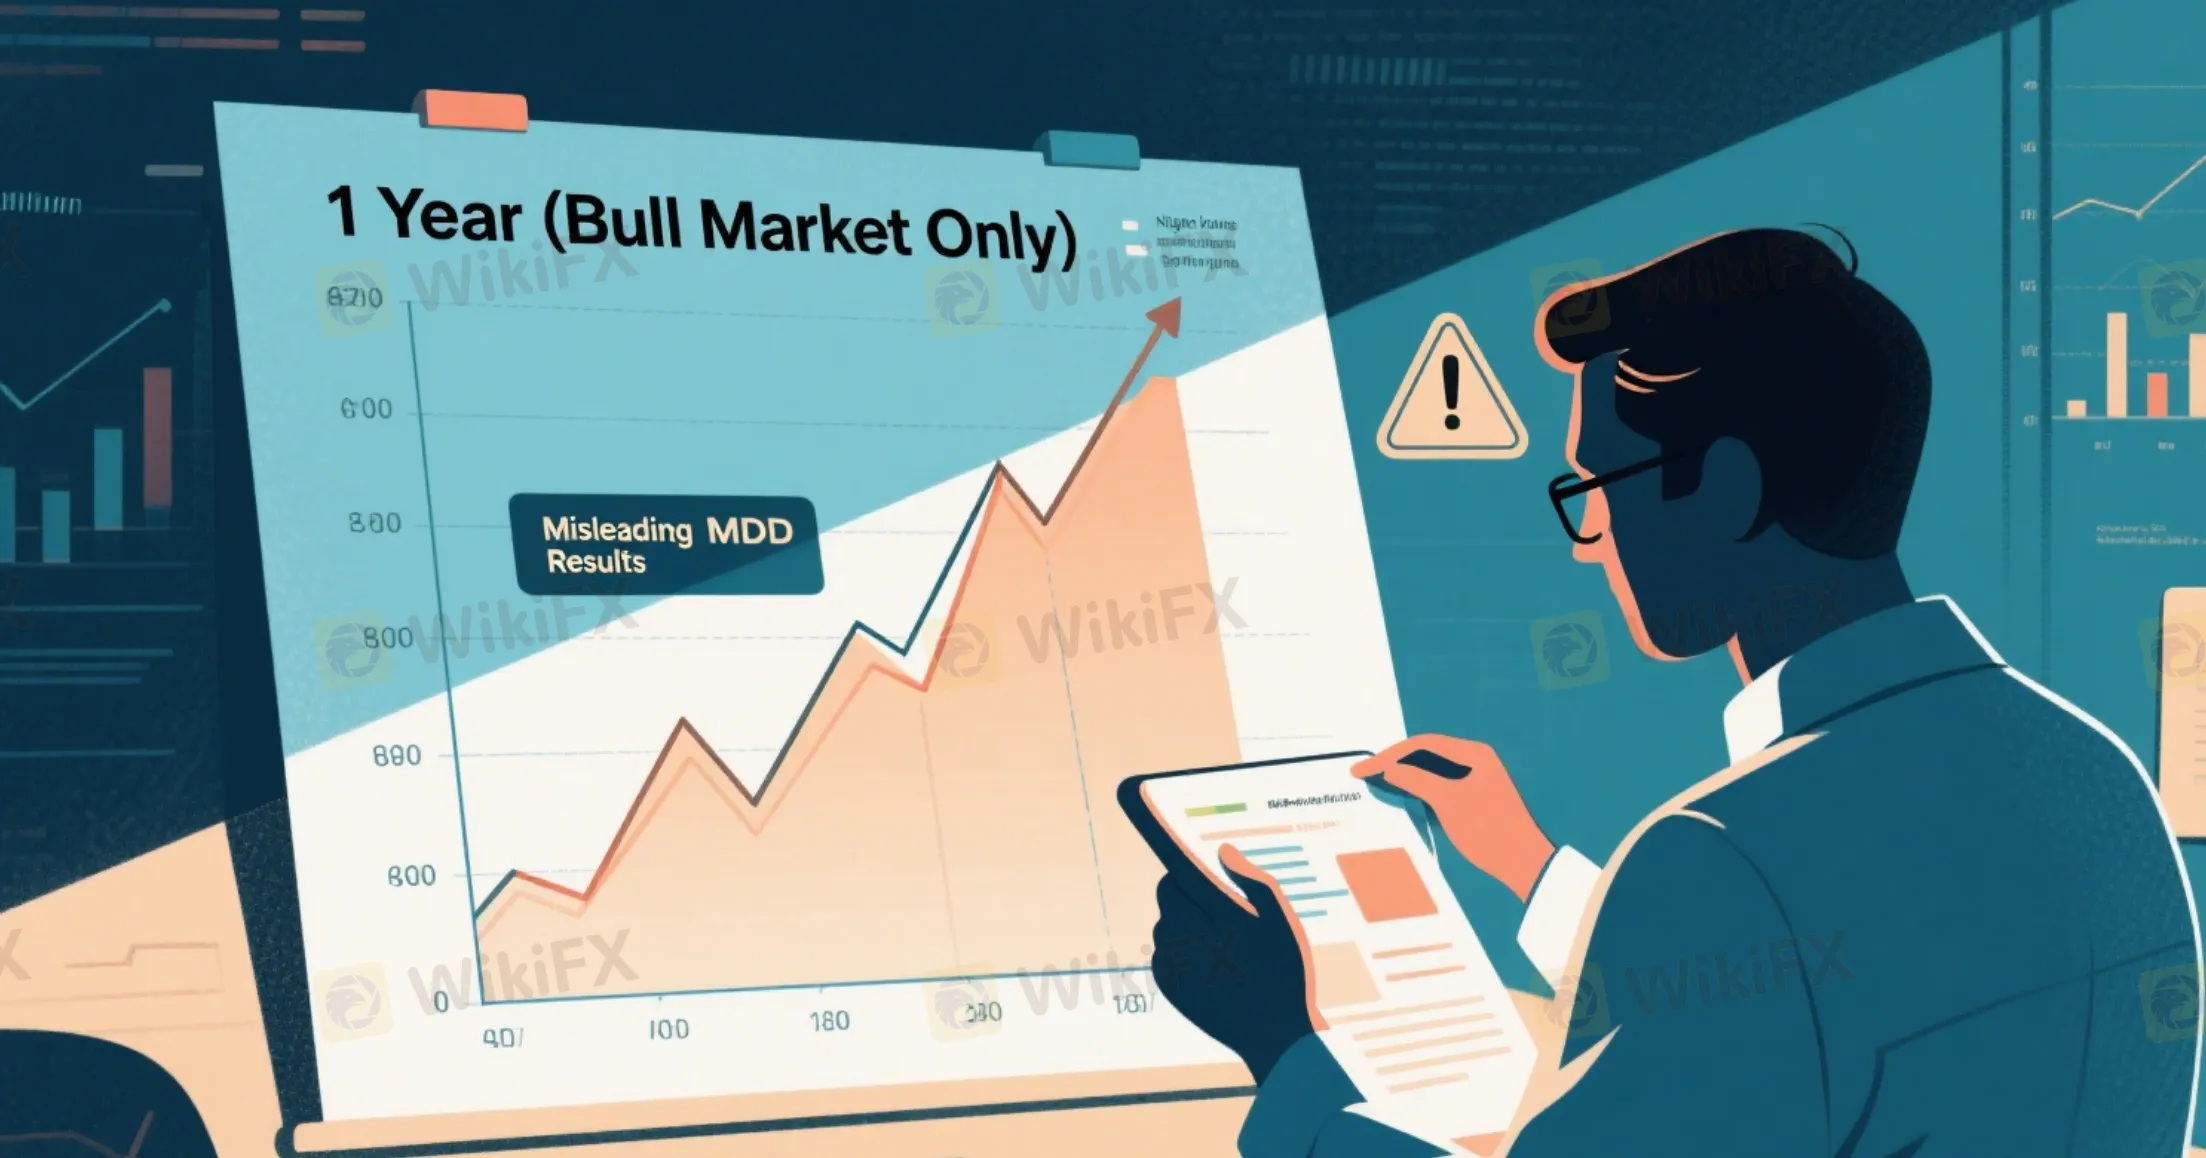
The most important MDD to discover is the one you find in testing, before risking real money. To get reliable MDD, stress-test your strategy against long, varied historical data. Testing just one year of a bull market produces misleadingly low MDD.
A solid backtest should cover at least 5-10 years, including different market conditions: strong trends, choppy ranges, high volatility (like financial crises), and low volatility. This reveals the true, battle-tested MDD of your system.
Recovering from a Drawdown
Every trader will eventually hit a new, unexpected MDD. It's painful but valuable. How you respond determines your long-term success.
- Stop the Bleeding: Stop trading immediately. Don't “revenge trade” or try to win it back quickly.
- Analyze, Don't Blame: Review your trade journal objectively. Were losses from your strategy performing normally during a bad run (bad luck), or from breaking your rules (bad decisions)?
- Reduce Risk: When ready to return, trade with much smaller size—maybe 25% or 50% of normal. The goal isn't making money; it's regaining confidence through well-executed trades.
- Focus on Process, Not Profit: Focus solely on executing your plan perfectly on a small scale. Discipline builds confidence, and confidence lets you slowly scale back up.
Common Mistakes to Avoid
Analyzing MDD seems simple, but several common mistakes can create false security and poor decisions.
1. Ignoring the Timeframe
A 10% Maximum Drawdown over three months isn't the same as 10% MDD over five years. Short samples are statistically meaningless. The strategy may not have faced major market events or volatility shifts. Always prioritize MDD figures from the longest possible timeframe.
2. Believing Past MDD is a Ceiling
Remember: “Past performance doesn't predict future results.” Your historical MDD is a guide, not a guarantee. It shows what happened, not the worst that can happen. Unprecedented conditions will occur, and your next MDD could exceed historical ones. Use historical MDD as a baseline, but build in safety margins.
3. Confusing Absolute and Maximum
This is a subtle but important difference:
- Absolute Drawdown: Measures the largest drop from your starting capital. Start with $10,000, drop to $9,000, absolute drawdown is $1,000.
- Maximum Drawdown: Measures the largest drop from the highest peak. Start with $10,000, grow to $15,000, drop to $12,000, MDD is $3,000 (20%), even though you're above your starting point.
MDD is more relevant because it measures the strategy's inherent volatility risk, not just relation to your starting point.
4. Chasing “Zero Drawdown”
Be very suspicious of any strategy marketed as having little to no drawdown. Perfectly smooth, upward equity curves are often red flags. These systems frequently use dangerous techniques like Martingale (doubling down on losses) or grid trading without stop losses. They may produce small, consistent gains for a while, then cause catastrophic 100% losses. A realistic MDD is a sign of an authentic trading strategy.
Making MDD Your Ally
We started by asking: what is drawdown in forex? We've traveled from that basic definition to understanding its most important measure, Maximum Drawdown. We've learned how to calculate it, interpret it, and integrate it into professional trading.
Maximum Drawdown isn't an enemy to fear or a grade on a report card. It's an ally to understand. It's a vital metric that brings reality to your trading, manages expectations, and builds true discipline. By calculating, understanding, and respecting your strategies' MDD, you can navigate forex markets with more confidence, resilience, and control.
Read more
Real Stories, Real Scam: How WikiFX Turns Evidence into Exposure
Victims reveal Forex trading scam stories on WikiFX. See how to collect evidence, expose fraudulent brokers, and help protect the trading community.

High Impact News Forex Today: Interest Rate Watch
High impact news forex today: traders eye rate paths as central bank signals and macro releases drive forex market volatility and currency pair moves.
WikiFX Report: MultiBank Group’s Footsteps in the Philippines
MultiBank Group, a global financial services provider, has launched operations in the Philippines a long time ago, where its entry, activities, and eventual retreat from the market left behind a trail of questions. This article reviews the broker’s history in the country, highlights specific cases, and underscores the importance of caution when dealing with MultiBank Group.
What is Free Margin in Forex? The Ultimate Guide for Traders
Mastering the concept of what is free margin forex is about more than just avoiding disaster. It's about securing your trading freedom. A healthy, well-managed free margin gives you the confidence and flexibility to execute your strategy effectively, withstand market volatility, and stay in the game long enough to achieve your goals. It's the foundation upon which a sustainable trading career is built.
WikiFX Broker
Latest News
Will MultiBank Become the Next TriumphFX?
WikiFXForex Lot Size Explained: A Complete Guide to Standard, Mini, & Micro Lots
WikiFXTrader’s Way Exposed: Where Winning Trades Turn into Losses Overnight
WikiFXCheckout List of 7 "FCA WARNED" Unauthorized Brokers
WikiFXPip Value Calculation Guide: How Much Is a Pip in Forex Really Worth?
WikiFXFootball Meets Finance: PSG Signs Global Partnership With WeTrade
WikiFXActivity Upgraded! The 2025 WikiFX “Global Broker Review Contest” Grandly Launches!
WikiFXWhat is Spread in Forex? How It Affects Your Trading Costs (A Complete Guide)
WikiFXSEC Flags Five More Unregistered Crypto Platforms in PH
WikiFXWebull Brings Crypto Trading Back to App
WikiFXRate Calc

