Best Binary Options Indicators: Enhance Your Trading Strategy

Abstract:Binary options trading involves predicting whether an asset's price will rise or fall within a specific timeframe. Unlike traditional investing, more specifically, binary options demand rapid decisions due to fixed expiry times (e.g., 60 seconds to 1 hour). For instance, speculating if EUR/USD will be above 1.0800 in the next five minutes. Success yields a fixed payout, while failure results in the loss of invested capital. Binary indicators distill complex market data—price action, volume, volatility—into actionable signals tailored for short-term trades. Indicators act as a compass, guiding traders to trends, reversals, and optimal entry points, thus enabling traders to detect market shifts for higher-probability decisions.
Binary Indicators: A short Introduction
Binary options trading involves predicting whether an asset's price will rise or fall within a specific timeframe. Unlike traditional investing, more specifically, binary options demand rapid decisions due to fixed expiry times (e.g., 60 seconds to 1 hour). For instance, speculating if EUR/USD will be above 1.0800 in the next five minutes. Success yields a fixed payout, while failure results in the loss of invested capital. Binary indicators distill complex market data—price action, volume, volatility—into actionable signals tailored for short-term trades. Indicators act as a compass, guiding traders to trends, reversals, and optimal entry points, thus enabling traders to detect market shifts for higher-probability decisions.
Pros and Cons of Binary Indicators
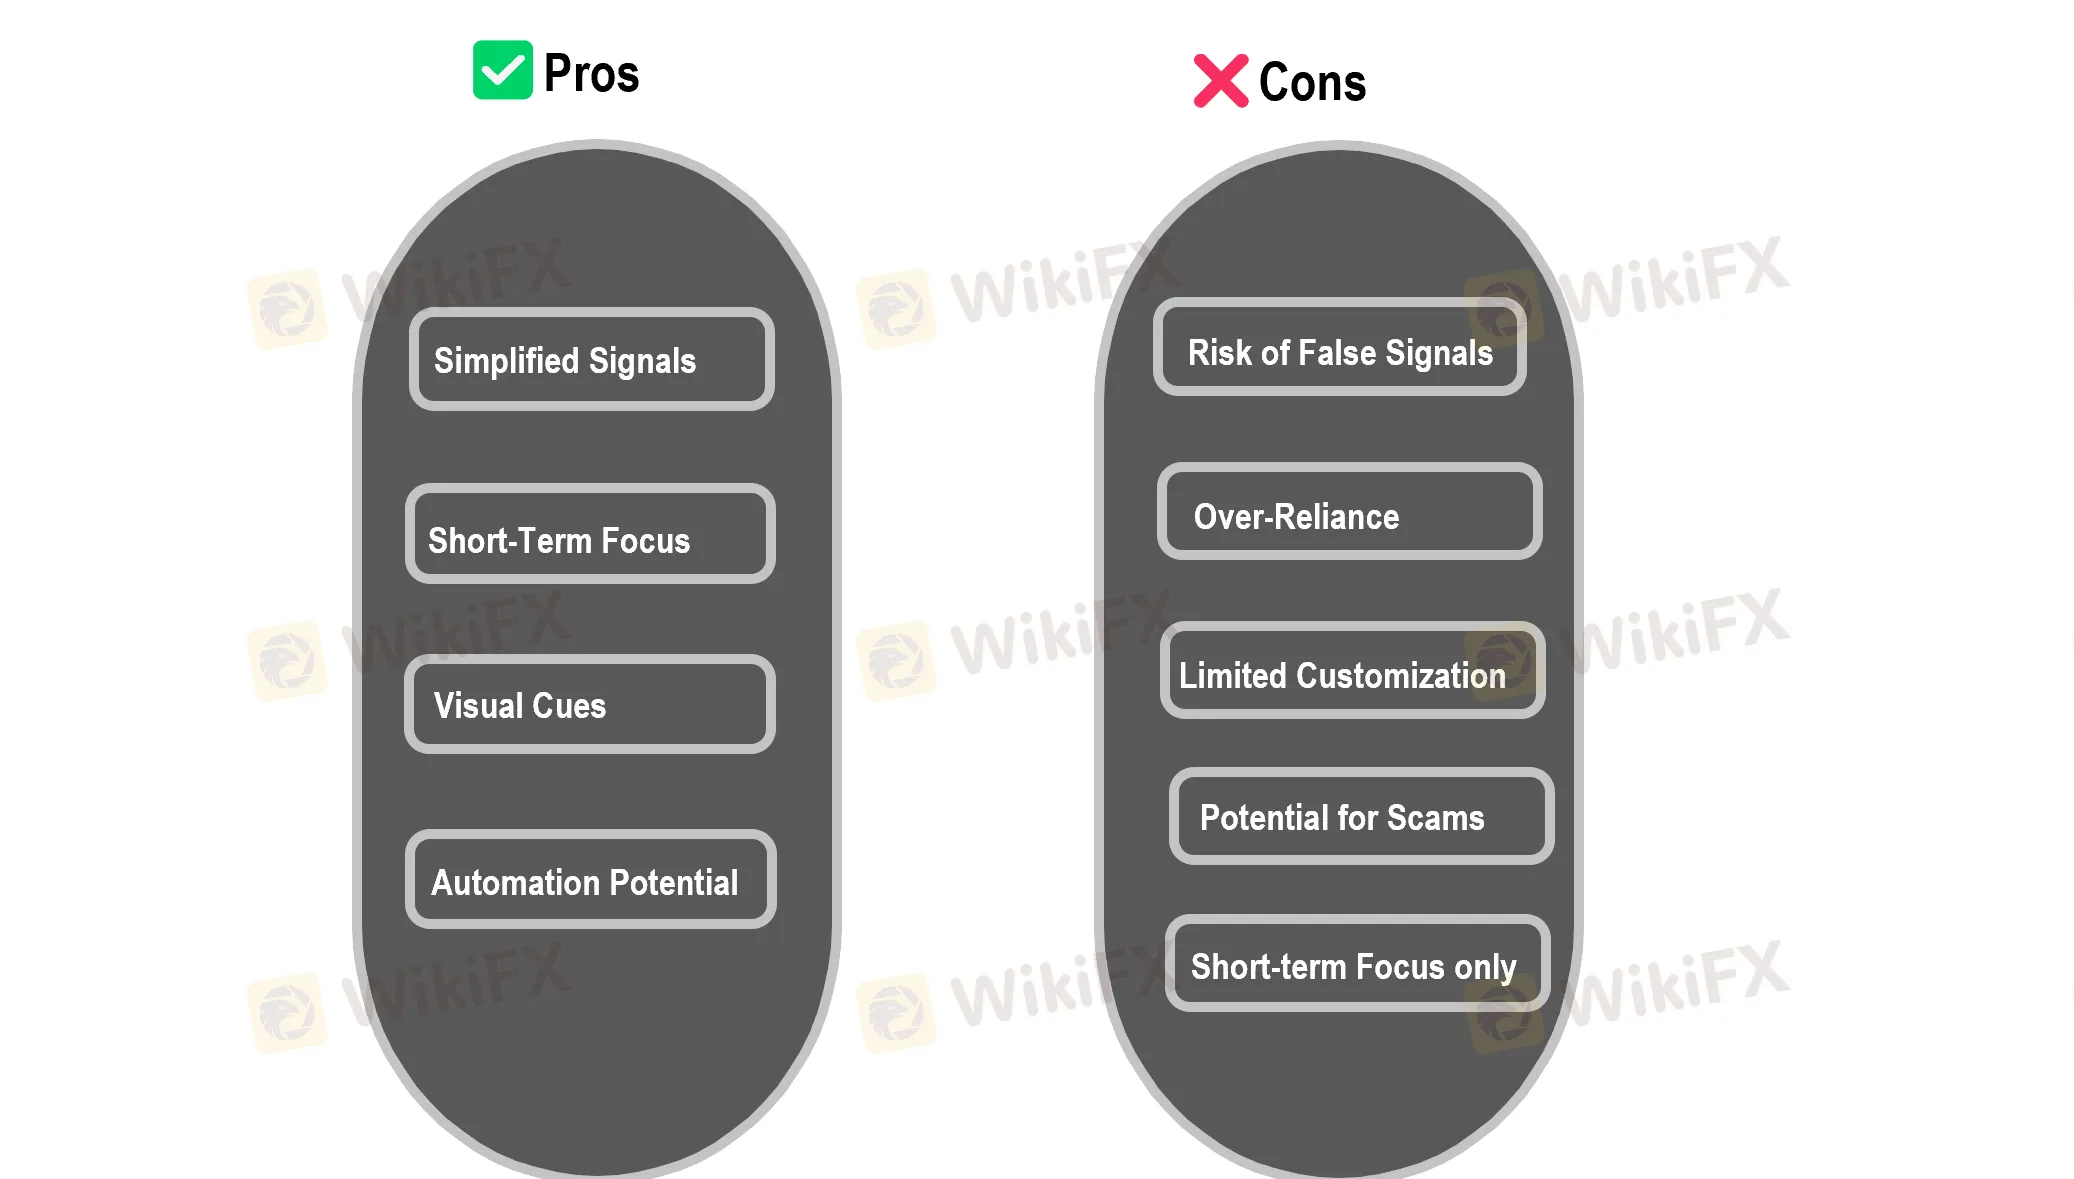
Pros of Binary Indicators:
- Simplified Signals: Binary indicators often provide clear, straightforward buy/sell signals, making them accessible to novice traders.
- Short-Term Focus: Binary indicators are typically tailored for short-term predictions, aligning with the fast-paced nature of binary options.
- Visual Cues: Many binary indicators use visual cues, such as arrows or color changes, to quickly communicate trading opportunities.
- Automation Potential: Some binary indicators can be integrated with automated trading platforms, allowing for hands-free trading.
Consof Binary Indicators:
- Increased Risk of False Signals: Due to their focus on short-term predictions, binary indicators can generate a higher frequency of false signals.
- Over-Reliance: Traders may become overly reliant on these indicators, neglecting other crucial aspects of market analysis.
- Limited Customization: Compared to standard technical indicators, binary indicators often offer limited customization options.
- Potential for Scams: The binary options market is known for scams, and many “guaranteed” binary indicators are fraudulent.
- Short-term focus only: Since binary options are short term, indicators made for them, usually do not give a good long term view of the market.
Best Binary Indicators to Explore
Strategy for Binary Options Galaxy (MetaTrader 4)
This premium algorithmic tool, specifically optimized for 5-minute binary option expiries, leverages historical data dating back to 2011 to generate buy/sell signals. It performs best when trading EURUSD and GBPCHF pairs during high-liquidity sessions, such as the London/New York overlap. For optimal performance, it is recommended to pair this tool with a 14-period RSI to filter out false overbought/oversold signals. For example, a trader with a $1,000 account achieved a 28% monthly return by executing 3-5 daily trades, adhering to a strict 5% risk management strategy per trade.
MACD (Moving Average Convergence Divergence)
This versatile trend-following tool effectively highlights momentum shifts, making it a valuable asset in binary options trading. Specifically, traders can utilize the MACD crossover—where the signal line intersects the MACD line—to identify potential trading opportunities with 15-minute expiry times. For instance, a bullish crossover observed on the GBPUSD currency pair during the Asian trading session, typically between 02:00 and 05:00 GMT, frequently precedes rallies of 20 to 30 pips.

Pivot Points
Pivot Points provide daily support and resistance levels derived from the previous day's price action. In binary options trading, traders can capitalize on price bounces off the S1 and R1 levels, utilizing 30-minute expiry times. For instance, in Gold binary options, prices frequently demonstrate a tendency to rebound from the Central Pivot Point during U.S. trading hours.

Bollinger Bands + RSI Combo
This strategy combines volatility and momentum indicators for effective breakout trading. Specifically, traders should initiate a CALL option when the asset's price touches the lower Bollinger Band, indicating an oversold condition, and simultaneously, the RSI rises above 30, confirming upward momentum. Backtest data reveals that on NASDAQ 100 binary options, this combination achieved a 68% win rate during sideways market conditions.

Ichimoku Cloud
The Ichimoku Cloud is a multi-dimensional indicator that offers insights into trend direction, support and resistance levels, and momentum. For binary options, traders can focus on price breaks above or below the cloud to inform 1-hour expiry trades. For example, a USDJPY price break above the Ichimoku Cloud during the Tokyo trading session, from 00:00 to 06:00 GMT, frequently signals a period of 4 to 6 hours of bullish momentum.

Sniper Alert Signals
The “Sniper Alert Signals” tool is designed for scalping, specifically targeting 60-second binary options trades. It operates by detecting micro-reversals in EURGBP and AUDJPY currency pairs through the analysis of fractal patterns. To mitigate the rapid drawdown risks inherent in such short-term trading, it's crucial to limit each trade to 1–2% of your trading capital.

The Fear & Greed Index
The Fear & Greed Index serves as a sentiment tool, quantifying market psychology on a scale from 0 (extreme fear) to 100 (extreme greed). In binary options trading, a strategy involves purchasing PUT options when the index exceeds 75, indicating overvalued markets driven by excessive greed, or conversely, buying CALL options when the index falls below 25, signaling undervalued markets due to extreme fear. Notably, in 2025, AI-powered sentiment analysis has been introduced, integrating this data into platforms like Deriv and IQ Option, enhancing the tool's accessibility and utility.

Case Studies: Real-World Success
Case 1: Scalping with Bollinger Bands
| Trader Type | Short-Term trader |
| Tradable Product | USDJPY |
| Expiry Time | 60-second |
| Entry | Price touches lower band + RSI < 35 |
| Results | 72% win rate over 200 trades, 18% monthly ROI |
A trader specializing in ultra-short-term trades employed Bollinger Bands on USDJPY 60-second binary options to capitalize on brief price fluctuations. The strategy hinged on identifying oversold conditions and potential reversals. Specifically, the trader monitored the 60-second chart for instances where the USDJPY price touched the lower Bollinger Band, indicating a potential oversold state. To further confirm this, they required the 14-period RSI to be below 35, signaling strong downward momentum that was likely unsustainable and ripe for a rebound.
When both conditions were met, the trader executed a 'Call' option, anticipating a short-term price increase. Over a period of 200 trades, this strategy yielded a 72% win rate, demonstrating its effectiveness in capturing small, rapid price movements. Implementing strict risk management, the trader achieved an 18% monthly return on investment (ROI), highlighting the potential profitability of well-executed scalping strategies with binary options. This case highlights the efficacy of pairing volatility and momentum indicators for rapid-fire trading strategies
Case 2: Trend Trading with Ichimoku
| Trader Type | swing trader |
| Tradable Product | Gold |
| Expiry Time | 1-hour expiries |
| Entry | Price breaks above cloud + volume surge |
| Results | 65% accuracy, 25% monthly returns |
A swing trader, focusing on medium-term price movements, utilized the Ichimoku Cloud indicator to identify strong, sustained trends in Gold binary options, targeting 1-hour expiry trades. The strategy centered on capitalizing on confirmed breakouts, indicating the beginning of a robust trend. The trader waited for the Gold price to decisively break above the Ichimoku Cloud, a signal that the asset was transitioning into a bullish phase. To further validate this breakout, the trader also required a noticeable surge in trading volume, confirming increased market participation and conviction behind the price movement.
When both the cloud breakout and volume surge conditions were met, the trader executed a 'Call' option, anticipating a continuation of the upward trend over the next hour. This strategy, implemented consistently, resulted in a 65% accuracy rate, meaning that 65 out of every 100 trades were profitable. This level of accuracy, combined with sound risk management principles, enabled the trader to achieve a 25% monthly return on their investment. This case illustrates the effectiveness of using a comprehensive indicator like the Ichimoku Cloud to identify and trade on significant trend shifts in binary options.
Some Common Mistakes to Avoid

Overloading Charts with Too Many Indicators
Many traders fall into the trap of cluttering their charts with excessive technical indicators, creating what's often called “indicator soup.” This approach can lead to analysis paralysis and contradictory signals that cloud judgment rather than enhance it.
For example, a trader might simultaneously use RSI, MACD, Stochastic Oscillator, Bollinger Bands, and multiple moving averages on a single chart. When these indicators give conflicting signals—perhaps RSI shows oversold conditions while MACD indicates a continuing downtrend—the trader becomes confused about which signal to prioritize. This confusion often leads to delayed decision-making or emotional trading based on whichever indicator confirms the trader's existing bias.
A more effective approach is to select 2-3 complementary indicators that serve different analytical purposes. For instance, combining a trend-following indicator (like a moving average) with a momentum oscillator (like RSI) and a volatility measure (like ATR) provides a more balanced and focused analysis framework.
Ignoring Asset-Specific Settings
Different market instruments behave according to their own unique characteristics, yet many traders apply the same technical analysis settings across all assets without adjustment. This one-size-fits-all approach significantly reduces analytical effectiveness.
For example, forex pairs like EUR/USD typically exhibit different volatility patterns than commodity futures like crude oil. Using the same 14-period RSI settings for both would be suboptimal. Forex markets might benefit from shorter timeframe indicators due to their 24-hour trading nature and tighter ranges, while commodities often require longer-period settings to filter out noise from their more volatile price movements.
Similarly, stock indices like the S&P 500 often respond well to volume-based indicators, whereas many forex pairs don't incorporate actual volume data (only tick volume), making such indicators potentially less reliable for currency trading. Traders should research optimal settings for each asset class and further fine-tune these parameters based on the specific instrument's historical behavior.
Neglecting Market News and Economic Events
Focusing exclusively on technical analysis while ignoring fundamental factors and scheduled economic releases is another common mistake that can lead to unexpected losses.
Consider a trader who spots what appears to be a perfect technical setup for a short position in USD/JPY, unaware that the Federal Reserve is scheduled to announce an interest rate decision in 30 minutes. When the Fed unexpectedly signals a more hawkish stance than anticipated, the market moves sharply against the trader's position, triggering stop losses.
Successful traders integrate economic calendars into their trading routine, noting high-impact events that could affect their positions. They either adjust their risk management approach before such events (widening stop losses or reducing position sizes), temporarily step aside from the market during major announcements, or deliberately trade the events with appropriate strategies designed for heightened volatility.
Additionally, staying informed about broader market themes—such as central bank policy directions, geopolitical developments, or sector-specific news for stocks—provides crucial context for technical analysis and helps traders understand the “why” behind price movements rather than just the “what.”
Useful Tips to Optimize Your Strategy with Indicators

Backtest Strategies on Historical Data
Effective backtesting of binary options strategies involves simulating your approach on historical price data using platforms like MetaTrader or TradingView. To ensure consistency, it's essential to test across a variety of market conditions, including trending, ranging, and volatile periods. This comprehensive testing approach helps validate the strategy's performance under different market dynamics, providing a more reliable assessment of its potential.
When evaluating backtest results, focus on key metrics such as win rate, risk-reward ratio, and maximum drawdown. For example, if a strategy combining RSI and Moving Averages yields a 65% win rate on EUR/USD hourly data but only 45% on GBP/JPY, adjustments to parameters or a shift in asset focus may be necessary. Crucially, prioritize robustness over perfection when optimizing indicators to avoid curve-fitting. Over-tweaking settings to precisely match historical data often leads to poor performance in live trading conditions, as the strategy becomes overly specialized to past market behavior.
Adjust Timeframes Based on Expiry
When trading binary options, aligning your chart timeframe with your chosen expiry time is critical. For short-term expiries, ranging from 1 to 15 minutes, utilize faster timeframes such as 1-minute or 5-minute charts. Employ responsive indicators like the Stochastic Oscillator or a 5-period RSI to capture quick momentum shifts, enabling you to capitalize on fleeting price fluctuations. These indicators are designed to react swiftly to short-term market changes, making them ideal for rapid trading decisions.
Conversely, for longer expiry times of 1 hour or more, shift your focus to higher timeframes, such as 15-minute or hourly charts. Opt for trend-focused tools like a 20-period EMA or the Ichimoku Cloud to filter out market noise and identify more sustained trends. These indicators provide a broader perspective, allowing you to discern the underlying market direction and make informed decisions for longer-duration trades. A crucial warning: mismatching your chart timeframe with your trade's duration, such as using a 1-minute chart for a 4-hour expiry, can lead to premature exits and missed opportunities. Always ensure your chart timeframe accurately reflects the intended duration of your binary options trade.
Combine Indicators with Price Action for Confirmation
Combining technical indicators with price action analysis can significantly enhance binary options trading strategies. Candlestick patterns, for example, can be paired with indicators to confirm potential reversals or continuations. A bullish MACD crossover, when coinciding with a bullish engulfing candle, strengthens buy signals by validating both momentum and price action. Similarly, identifying support and resistance levels can be augmented with indicator confirmations. If the price tests a key support level and the RSI indicates an oversold condition (≤30), it reinforces the likelihood of a price reversal.
Furthermore, integrating volume analysis, where available, can provide valuable insights into momentum. A Bollinger Band squeeze accompanied by rising volume suggests an impending breakout, indicating increased market participation and conviction. Combining indicators with price action provides a holistic market view, enabling traders to make sharper, more potentially profitable decisions.
Conclusion
Overall, successful binary options trading requires a strategic blend of technical indicators and disciplined risk management. By tailoring indicators to specific assets and timeframes while conducting thorough backtesting, traders can improve their accuracy. However, maintaining market awareness and avoiding common pitfalls like indicator overload also matters.
Read more

Oron Trade Review 2026: Why Should I Accept Just $100 Out of $15000 Balance? Read Our Investigation!
This is the problem an Indian trader reportedly faced on the Oron Trade platform. The Saint Lucia-based forex broker, despite receiving positive reviews for a low minimum deposit and a 5% monthly withdrawable bonus, continued to be criticized by users for its withdrawal processing. In this Oron Limited review, we have thoroughly investigated user claims and revealed whether this brokerage firm is regulated.
TopFX Review 2026: Profits Earned, Account Terminated, Withdrawal Denied? Check This Investigation
TopFX, a Cyprus-based brokerage entity, continues to face user allegations globally, including those in South Asia. While complaints against the firm are on several issues, the one that is very concerning is the alleged account termination following a withdrawal request by traders upon profit generation on the platform. Traders have even opposed deposit delay and operational glitches concerning leverage. In this TopFX review, we have examined wide-ranging allegations against the broker while also sharing its regulatory framework for an informed decision-making experience.

octa Review 2026: Is There an End to My Endless Failed Withdrawal Requests? We Examined This Claim
octa, a Cyprus-based brokerage company, continues to face a common question from traders: when will my withdrawal requests be successfully processed? Maybe not literally, but contextually, it is allegedly the issue many traders have reported on broker review platforms such as WikiFX. Regardless of the trader’s region, be it South Asia, Indonesia, Brazil or any other, most traders have expressed their concerns over the alleged withdrawal delays or denials. In this octa review, we have examined several user allegations concerning withdrawal issues and other problems encountered on the platform.

IQ Option Review 2026: Am I Supposed to Deposit Only? What About My Withdrawals?
This is what many traders are asking while trading with IQ Option, an Antigua and Barbuda-based brokerage entity. Their wrath is evident through massive negative reviews on several broker review platforms. WikiFX, a widely recognized forex broker regulation inquiry tool, itself recorded over 120 complaints from users worldwide. The complaints largely highlight the alleged withdrawal denial by the broker. Users have deposited millions but allegedly failed to withdraw funds when they needed to. While they may just be allegations and not an established fact, they are worth looking at, considering a large volume of complaints pointing to a potential investment scam. In this IQ Option review 2026, we have examined several complaints while providing an overview of the company’s regulatory framework.
WikiFX Broker
Latest News
21 Arrested in Melaka Raid on Fake Stock Investment Call Centre
WikiFXOcta Review: Profit Withdrawals, Account Blocks, and Broker Risk Signals
WikiFXSpotting Forex Ponzi Schemes and Confidence Scams Before You Deposit
WikiFXWhat Indian Beginners Should Check Before Choosing a Forex Broker
WikiFXINVESTIZO Review: Unregulated Broker Under Fire Over Withdrawals and Profit Cancellation
WikiFXBuild Trading Discipline Using a Bar-by-Bar Blind Test
WikiFXBreak the Habit of Adding to Your Losing Trades
WikiFXBehind the Regulated Facade: Is ACCUMARKETS Freezing Out Successful Traders?
WikiFXFBS Review: CySEC & ASIC Licensed, Yet Scored 2.51 , What's Really Going On?
WikiFXIpoh Businessman Loses RM1.25 Million in Crypto Group that Promised High Returns
WikiFXRate Calc

