KVB Market Analysis | 7 August: AUD/USD Recovers Above 0.6500 Amidst RBA Hawkish Hold and Commodity Price Gains
Abstract:Following fresh 2024 lows near 0.6350, AUD/USD bounced back above 0.6500 on Tuesday, returning to positive weekly territory. The pair remains focused on the 200-day SMA at 0.6592, with a negative bias expected below this level. The recovery was supported by rising copper and iron ore prices and a hawkish hold from the RBA.
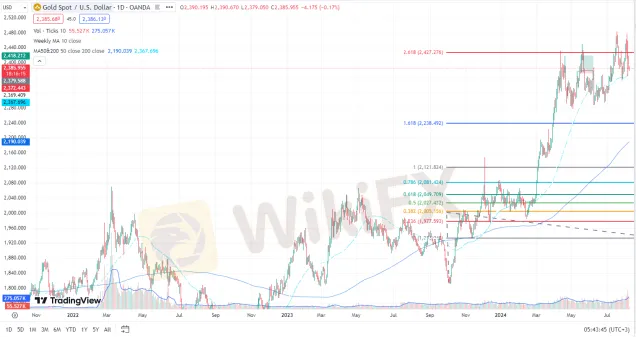
Product: XAU/USD
Prediction: Increase
Fundamental Analysis:
XAU/USD extends Mondays losses and trades in the $2,380 price zone as markets abandon panic. On the one hand, stocks are in better shape after collapsing at the beginning of the week, with United States (US) indexes trading in the green after mixed results among their overseas counterparts. The better tone of equities undermines demand for Gold. On the other hand, government bond yields recovered, with the 10-year Treasury note yield up over 20 basis points (bps) after falling to fresh multi-year lows, supporting the US Dollar against the bright metal. Nevertheless, market players are still concerned about the United States (US) economic health and maintain bets on massive interest rate cuts before year-end.
Technical Analysis:
XAU/USD trades around the 50% Fibonacci retracement of its June/July rally at $2,388.70, and technical readings in the daily chart show that the risk is skewed to the downside. The pair met intraday buyers around the 38.2% retracement of the same run at $2,411.20, while the 20 Simple Moving Average (SMA) converges with the mentioned level, losing its bullish strength. In the near term, and according to the 4-hour chart, the bearish case is even stronger. Technical indicators resumed their slides within negative levels and after correcting oversold conditions. At the same time, the 20 SMA gains downward traction well above the current level, while XAU/USD keeps putting pressure on a mildly bullish 200 SMA.
Support levels: 2,372.90 2,366.00 2,352.40
Resistance levels: 2,411.20 2,424.10 2,438.80
Product: EUR/USD
Prediction: Increase
Fundamental Analysis:
Panic receded on Tuesday after dominating the first day of the week, helping the safe-haven US Dollar to recover some ground. The EUR/USD pair kept retreating from a fresh multi-month high of 1.1008 and traded near the 1.0900 threshold ahead of the United States (US) opening. Nevertheless, markets have not yet stabilised.
Technical Analysis:
From a technical point of view, the EUR/USD pair trades at around Friday‘s close, trimming Monday’s gains. The corrective slide may extend in the upcoming sessions, as technical indicators turned firmly lower, although the Relative Strength Index (RSI) indicator remains within positive levels, limiting the bearish case. Even further, EUR/USD develops above all its moving averages, with the 20 Simple Moving Average (SMA) advancing above the longer ones, in line with the dominant bullish trend. In the near term, and according to the 4-hour chart, the ongoing slide seems corrective. Technical indicators have retreated sharply from overbought readings and maintain their downward slopes within positive levels. At the same time, the 20 SMA keeps heading north above directionless 100 and 200 SMAs, but its partially losing its upward strength. A break through the 1.0890 support should anticipate another leg south, although buyers are likely to take their chances on dips.
Support levels:1.0890 1.0845 1.0800
Resistance levels: 1.0950 1.1005 1.1045

Product: USD/JPY
Prediction: Decrease
Fundamental Analysis:
This week Fed members attempted to instill calmness to the market, accepting that the job market has eased but cautions against reading too much into one labour report. The Fed has admitted that the risks of maintaining restrictive monetary policy are more finely balanced. Holding rates at elevated levels hinders economic activity, hiring and employment and so at some stage the fight against inflation can jeopardise the Feds employment mandate. The Fed is expected to announce its first rate cut since the hiking cycle began in 2022 but the discussion now revolves around the number, 25 bps or 50 bps? Markets assign a 75% chance of a 50 bps cut which has amplified the downside move in USD/JPY.
Technical Analysis:
While the RSI remains well within oversold territory, this is a market that has the potential to drop for some time. The unravelling of carry trades is likely to continue as long as the Fed and BoJ remain on their respective policy paths. 140.25 is the next immediate level of support for USD/JPY but it wouldnt be surprising to see a shorter-term correction given the extent of the multi-week sell-off.

Product: AUD/USD
Prediction: Increase
Fundamental Analysis:
Following Monday‘s fresh 2024 lows near 0.6350, AUD/USD managed to regain some composure and advance north of 0.6500 the figure on turnaround Tuesday, returning at the same time to the positive territory on the weekly chart. The AUD’s initial focus, in the meantime, remains on the critical 200-day SMA at 0.6592. While below this region, the negative bias is expected to prevail in the pair. Tuesdays marked bounce in the Aussie dollar was also accompanied by an acceptable recovery in both copper prices and iron ore prices, regaining some mild upside traction amidst the ongoing multi-week retracement. Further strength around the Australian currency came after the RBA delivered a hawkish hold at its meeting early on Tuesday.
Technical Analysis:
The resurgence of the bearish tone could see AUD/USD revisit the 2024 bottom of 0.6347 (August 5), ahead of the 2023 low of 0.6270 (October 26). Bullish attempts, on the other hand, may face first resistance at the significant 200-day SMA of 0.6592, seconded by the temporary 100-day and 55-day SMAs of 0.6601 and 0.6643, respectively, before reaching the July high of 0.6798 (July 8) and the December top of 0.6871. The four-hour chart shows that some consolidation kicked in. That said, initial support comes at 0.6347, followed by 0.6338 and 0.6270. On the plus side, the initial barrier is at 0.6559, ahead of 0.6610 and the 200-SMA of 0.6649. The RSI rose to around 54.

Market Analysis Disclaimer:
The market analysis provided by KVB Prime Limited is for informational purposes only and should not be construed as investment advice or a recommendation to buy or sell any financial instrument. Trading forex and other financial markets involves significant risk, and past performance is not indicative of future results.
KVB Prime Limited does not guarantee the accuracy, completeness, or timeliness of the information provided in the market analysis. The content is subject to change without notice and may not always reflect the most current market developments or conditions.
Clients and readers are solely responsible for their own investment decisions and should seek independent financial advice from qualified professionals before making any trading or investment decisions. KVB Prime Limited shall not be liable for any losses, damages, or other liabilities arising from the use of or reliance on the market analysis provided.
By accessing or using the market analysis provided by KVB Prime Limited, clients and readers acknowledge and agree to the terms of this disclaimer.
RISK WARNING IN TRADING
Transactions via margin involve products that use leverage mechanisms, carry high risks, and are certainly not suitable for all investors. THERE IS NO GUARANTEE OF PROFIT on your investment, so be wary of those who guarantee profits in trading. You are advised not to use funds if you are not prepared to incur losses. Before deciding to trade, ensure that you understand the risks involved and also consider your experience.

Read more

EGRs vs ETFs - Which is a Better Way to Invest in Gold?
The National Stock Exchange (NSE) recently launched Electronic Gold Receipts (EGRs), a digital way to invest in exchange-backed physical gold. A little less than four years ago, the Bombay Stock Exchange (BSE) introduced EGRs in October 2022. Gold Exchange Traded Funds (ETFs), another useful way to invest in gold, have already been in the market for a long time. So, the debate keeps happening on EGRs vs ETFs among gold buyers in India. In this article, we have defined and compared these two to find which one benefits you more.

LOYAL PRIMUS Review: Allegations of Account Disablement and Withdrawal Denials
Did your attempt to withdraw funds from the LOYAL PRIMUS platform lead to your account deactivation by the broker? Did the broker prevent you from withdrawing when you made profits? Did the broker cancel your withdrawal application by accusing you of suspicious trading activity? These allegations have grown in numbers on independent broker review tools such as WikiFX. In this LOYAL PRIMUS review article, we have examined all these allegations thoroughly.

Top Secrets Why the Indian Government Appeals for a NO Gold Purchase
Is it the effect of ongoing Israel-Iran-US conflict, the surging import of the yellow metal or any other economic indicators that the Indian Prime Minister made an appeal to the countrymen to stop buying gold for a year? Addressing the public rally, the PM also advised postponing travel, limiting the use of petrol, diesel and cooking oil, and transitioning to the work from home model as much as possible. He categorically mentioned: Save dollars, conserve India’s foreign exchange reserves. Read on!

India’s Love Affair with Gold: Investment Demand Rises 40% of Consumption in CY25
In the latest news that further establishes India as the destination for gold, the data issued by CareEdge Ratings demonstrated the country’s never-ending love for the yellow metal with a record investment surge of approximately 40% of overall consumption in Calendar Year 2025. This is arguably the highest in recent times. The ETF inflows alone added 37.5 tonnes, surpassing the combined investment of the last ten years. According to the ratings agency, geopolitical uncertainty and record prices made people quickly move away from jewellery.
WikiFX Broker
Latest News
Why Employment Data Releases Destroy Short-Term Forex Trades
 WikiFX
Making Sense of Central Bank News: How Revaluation, Interest Rates, and Reserves Move Currencies
WikiFXFive Chinese Fined RM4,000 Each for Promoting Cryptocurrency Investment Scheme in Malaysia
WikiFXFBS Review 2026: Is This Forex Broker Safe?
WikiFXTOPFX Review 2026: CYSEC Regulation and Withdrawal Risks
WikiFXPBOC Rate, Crude Oil, and Aussie in Focus
WikiFXReading Hammer and Engulfing Candles to Time Trade Entries
WikiFXReal Trades vs. Fake Algorithms: Lessons From a $125 Million Scam
WikiFXCrude Rebounds Over Strait Closure
WikiFXDollar Tests 161 Yen Amid Hormuz Oil Shock
WikiFXRate Calc

